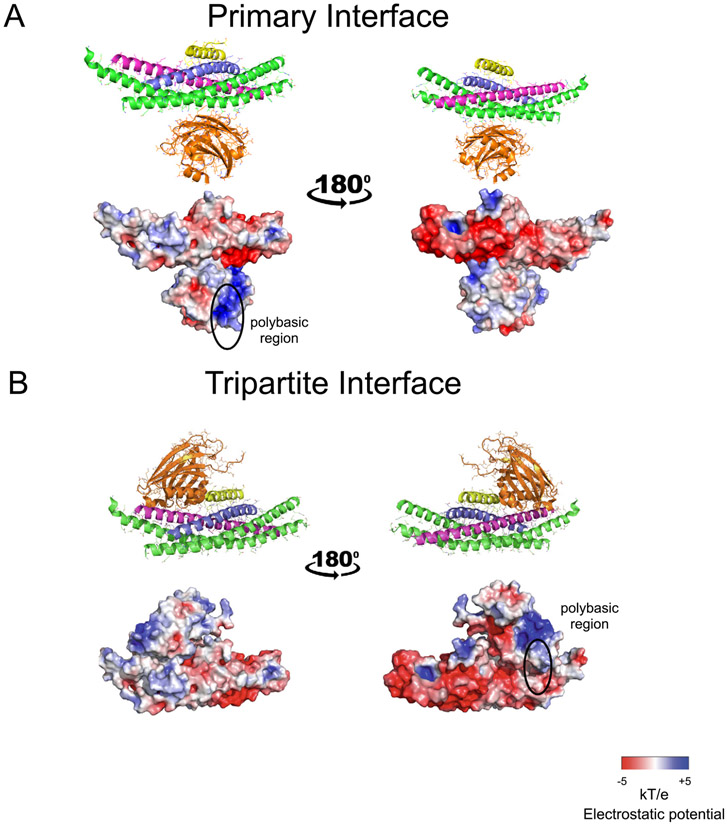
Figure 2. Crystal structures, and charge distributions of primary and tripartite interfaces.
(A) The Syt1 C2B domain (orange) is shown that forms the primary interface with the SNARE complex (blue, magenta, green) in the crystal structure of the SNARE–Cpx1–Syt1 complex4 (PDB ID 5W5C). The central α-helix of Cpx1 (yellow) is also shown. (B) The Syt1 C2B domain (orange) is shown that forms the tripartite interface with the SNARE complex (blue, magenta, green) and Cpx1 (yellow)4 (PDB ID 5W5C). Two views related by a 180° rotation are shown. The top panels are cartoon and bond representations; the bottom panels are electrostatic potential maps. The electrostatic potential maps were calculated with the APBS plugin and displayed using PyMol (Schrödinger, LLC.).

