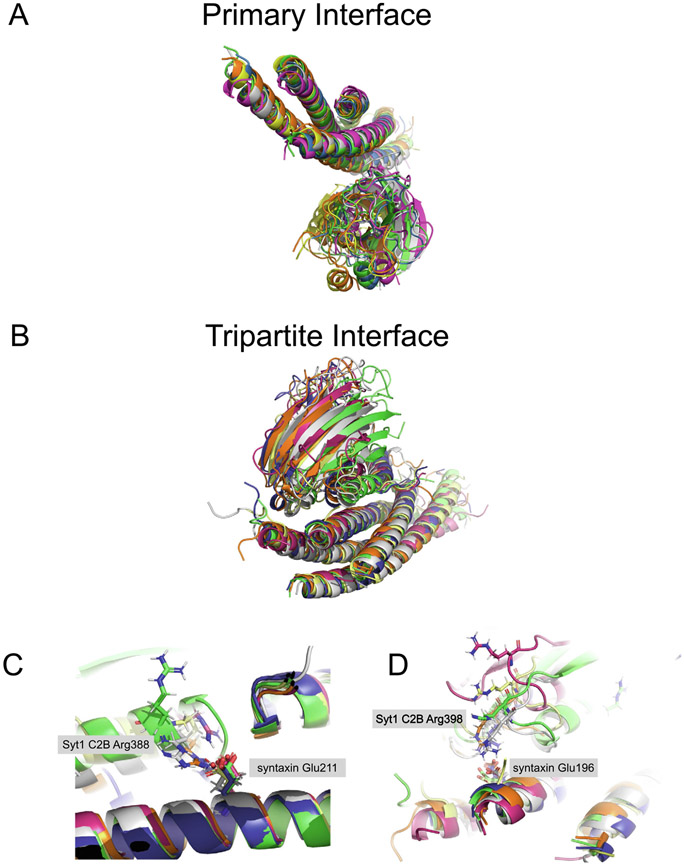
Figure 4. Molecular dynamics simulations of primary and tripartite interfaces.
(A) End points of five independent 1-μsec simulations (colors) of the primary interface (previously published in ref. 68). Shown are cartoon representations using PyMol. Crystal structure (PDB ID 5W5C): green; simulation 1: magenta; simulation 2: yellow; simulation 3: blue; simulation 4: orange; simulation 5: gray. (B) End points of five independent 1-μsec simulations (colors) of the tripartite interface (Methods). For simulations 1 and 2, the coordinates of the molecular dynamics trajectory are shown before dissociation occurred (0.629 μsec and 0.911 μsec, respectively). Shown are cartoon representations using PyMol. Crystal structure (PDB ID 5W5C): green; simulation 1 at 0.629 μsec, magenta; simulation 2 at 0.911 μsec, yellow; simulation 3 at 1 μsec, blue; simulation 4 at 1 μsec, orange; simulation 5 at 1 μsec, gray. (C) Close-up view of a Syt1 C2B Arg388 – syntaxin-1A Glu211 predicted salt bridge that forms in 4 out of 5 simulations. (D) Close-up view of a Syt1 C2B Arg398 – syntaxin-1A Glu196 salt bridge that forms in 3 out of 5 simulations. PyMol session files corresponding to panels A and B are in Supplementary Information.

