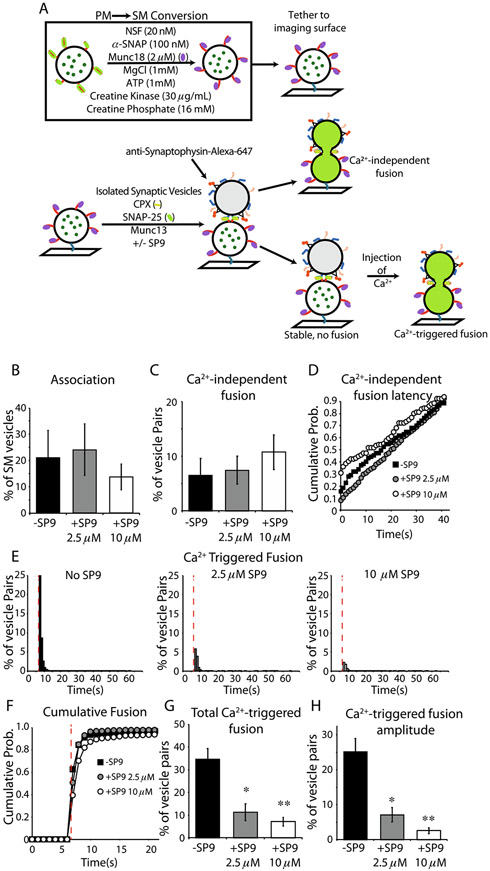
Figure 7. SP9 inhibits Ca2+-triggered fusion and synchronization with Ca2+ arrival but not vesicle association or stability of association.
(A) Schematic workflow of the fusion assay, red lines indicate syntaxin-1A; green lines indicate SNAP-25A; purple ovals represent Munc18; blue lines represent synaptobrevin-2; orange lines represent Syt1; yellow lines present Cpx1, and green dots indicate sulforhodamine. (B) Association of SM-ISV pairs in the absence (black) or presence of 2.5 μM SP9 (gray) or 10 μM SP9 (white). (C) Ca2+-independent fusion rate of SM-ISV pairs. (D) Cumulative probability histogram of time between association and Ca2+-independent fusion of vesicle pairs in panel C. (E) Histograms of fusion time after Ca2+-injection (red dashed line) in the absence of SP9 (left), 2.5 μM SP9 (center), and 10 μM SP9 (right). (F) Cumulative probability distribution of the histograms in panel E. (G) Total percentage of SM-ISV pairs that fused after Ca2+ injection. (H) The amplitude of the first time bin after Ca2+ injection shows the SP9 peptide decreases the synchronization of fusion with Ca2+ arrival. Error bars indicate the standard error of 6 technical replicates from 3 biological replicates for No SP9 condition, 8 technical replicates from 2 biological replicates for the 2.5 μM SP9 condition, and 13 technical replicates from 3 biological replicates for the 10 μM SP9 condition.

