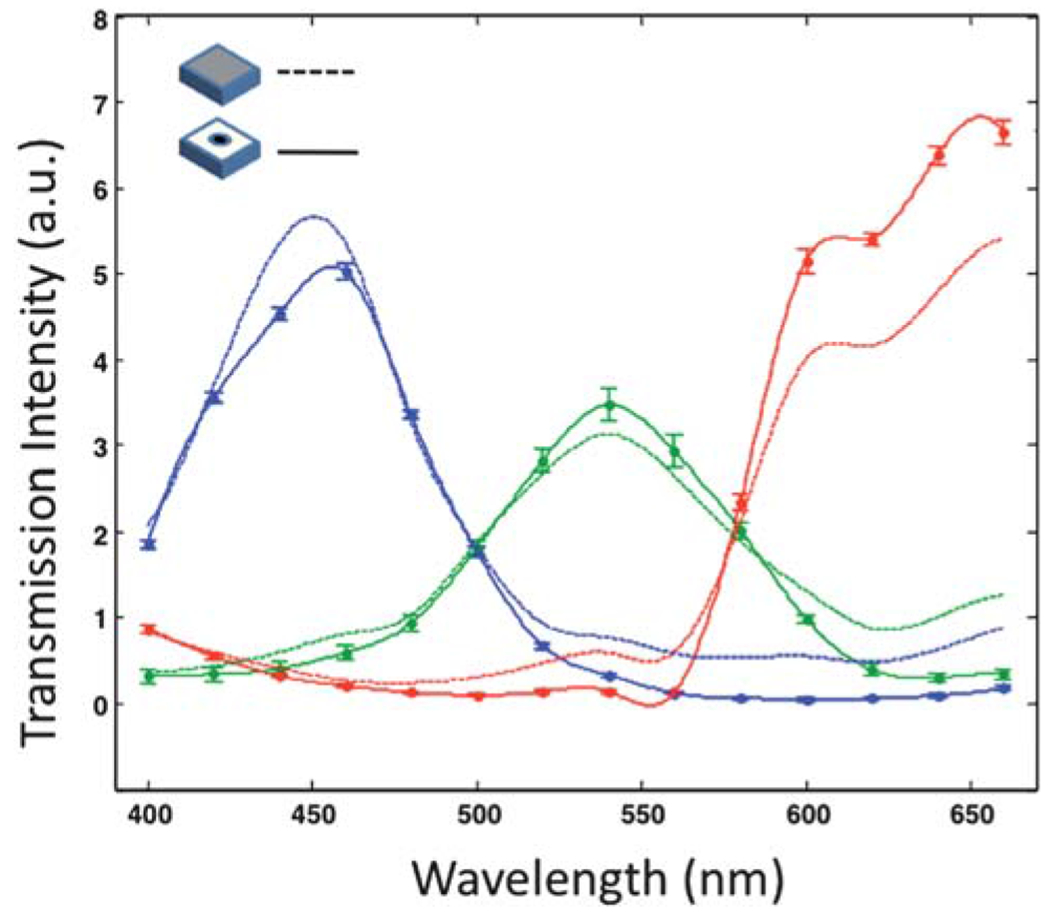
Fig. 2.

The aperture effect on spectral response of the sensor: the solid lines represent the measured transmission data from a color OFM device; the dash lines are the response from a CMOS sensor without any fabrication process. All the transmission data are normalized at 400 nm.
