
Fig. 4.
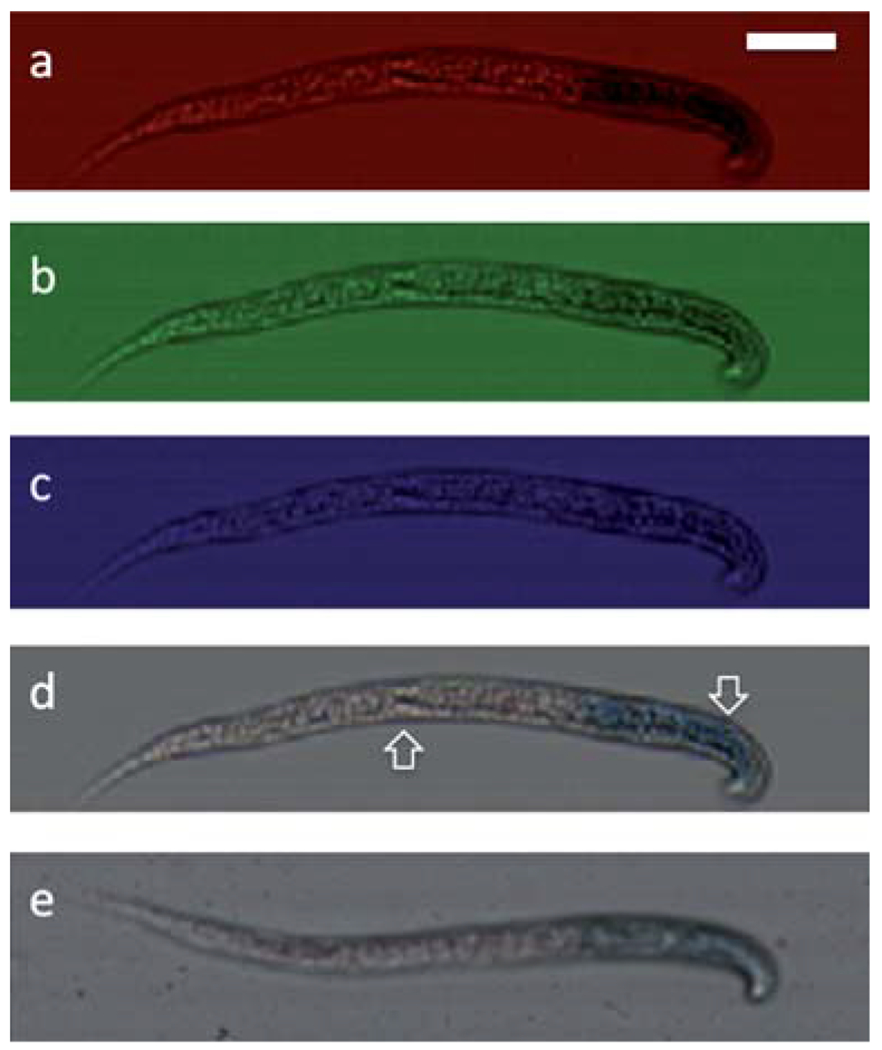
Construction of a color OFM image of C. elegans with LacZ expression. (a)–(c) From top to bottom are the images from red, green, blue pixels of a C. elegans with blue Xgal stain and Ponceau stain image, (d) the constructed color OFM image shows the nonspecific Ponceau stain (left arrow) and the LacZ staining of the pharyngeal muscles (right arrow), (e) the conventional 10× microscope image of the same sample. The scale bar is 20 microns.