

Abstract
We investigate the hydration of poly(3-[2-(acrylamido) ethyldimethylammonio] propanesulfonate) over a range of temperatures in pure water and with the inclusion of 0.1 mol / L NaCl using atomistic molecular dynamics simulation. Drawing on concepts drawn from the field of glass-forming liquids, we use the Debye-Waller parameter for describing the water mobility gradient around the polybetaine backbone extending to an overall distance ~ 18 Å. The water mobility in this layer is defined as the mean square displacement at a time on the order of water’s -relaxation time. The brush-like topology of polybetaines leads to two regions in the dynamic hydration layer. The inner region of ≈ 10.5 Å is explored by pendant group conformational motions, and the outer region of ≈ 7.5 Å represents an extended layer of reduced water mobility relative to bulk water. The dynamic hydration layer notably extends far beyond the static hydration layer, adjacent to the polymer.
Keywords: polybetaine, zwitterionic polymers, static hydration layer, dynamic hydration layer, water mobility gradients, Debye-Waller parameter, molecular dynamics
Graphical Abstract

1. Introduction
Applications of polybetaine materials in biomedical, filtration, and drug delivery fields continue to grow steadily.1–17 Zwitterionic polymers of this kind contain both anionic and cationic functionality within a monomer’s pendant group, giving rise to overall charge neutrality of this class of polymers and a tendency to strongly complex with water. In particular, the combination of their high charge density and inherent charge neutrality has led to important applications of polybetaines in creating materials with stimuli-responsive, anti-biofouling, and low friction properties.1–16 In particular, the stimuli-responsiveness of polybetaines, in combination with their bio-compatibility, makes these materials of immense interest in developing vehicles for drug-delivery8–12 and for membrane filtration13,14,14–16 applications. Property changes due to changes in thermodynamic conditions or solution composition often result from four main stimuli that have been emphasized: pH, temperature, salt type, and salt concentration. Temperature and pH sensitivity of these polymers are often the basis for drug-delivery applications based micellar8–10 and hydrogel11,12 forms of these materials, while salt responsiveness is often utilized in connection with self-cleaning13,14 and size-selective15,16 polyzwitterion membrane materials for protein purification. Each applied stimulus type has been interpreted as arising from the interference with betaine-betaine (i.e., pendant-pendant) associative interactions, resulting in striking reductions in hydrogel mechanical properties (i.e., storage and loss moduli18) of these materials, the expansion of the polybetaine chains in grafted layers,19 or the dissolution of polybetaine polymers in solution20. Phase diagrams of polybetaine solutions exhibit liquid-liquid phase separation upon cooling21, rather than the more commonly encountered phase separation upon heating found in common water-soluble polymers, such as polyethylene oxide and poly(n-isopropylacrylamide) (pNIPAM).22 Polybetaine and other polyzwitterion polymers evidently have many solution properties that are different from other water soluble polymers, which accounts for their niche applications. Once the driving force behind the attractive polybetaine behaviors is fully understood, potential applications associated with a combination of the responsive properties of polyzwitterionic polymers with the supramolecular assembly characteristics of block co-polymers may continue to develop from preliminary studies8,10.
As noted earlier, polybetaines are also of particular interest for their anti-fouling applications of technological interest in the biomedical1,2 and membrane filtration3–5 fields. In particular, sulfobetaine methacrylate (SBMA) polyzwitterionic polymers have been shown to form ultra-low biofouling surfaces when grafted to a surface with a sufficient high density.3,6 Several studies have indicated that sulfobetaine hydrogel materials1,2 and polymer brush films5,7 can be highly resistant to non-specific protein binding, making these materials attractive as suitable materials for medical implants.1,11 The presence of a strong hydration layer in polybetaine brush films has been offered as an explanation of the characteristically low friction in polymer layers of this kind.23,24 While the properties of sulfobetaine materials are often attributed to strong hydration, the actual physical origin of these effects, and even the physical nature of the hydrating layer, remain imperfectly understood. Since applications of the unique stimuli-responsive and anti-fouling properties of polybetaine and other polyzwitterion polymers are highly prized, the present work focusses on the quantification of hydration layer in this class of polymers, especially the dynamics of the hydration layer.
Simulation studies of stimuli responses of polybetaines are limited and have tended to emphasize the role of hydration on the anti-fouling properties of this class of polymers. Coarse-grained simulations23 have considered completive self- and solvent-interactions of polybetaines in relation to understanding qualitative trends in their stimuli-responsive properties. Recently, simulation studies have begun to focus on the physical nature of polybetaine hydration.25–27 As a starting point, bio-sourced betaine, glycine, has served as a model system for understanding how molecular structure and chemistry influence hydration with a view of identifying factors that might be controlled in order to create more effective anti-fouling surfaces.27 That work indicated structural evidence for a hydration layer that extended 1.5 or 2 water layers (i.e., solvation shells) around the betaine molecule, based on a local tetrahedral order parameter appropriate to water, suggesting a hydration layer thickness on the order of a couple Å. These simulations also claimed evidence supporting that the presence of the polymer hydration layer reduced the strength of the polymer self-interactions, a phenomenon inferred to be key for understanding the observed anti-fouling properties of these materials.27 Another notable molecular dynamics (MD) study focusing on the interaction of lysozyme molecules with a high grafting density phosphorylcholine polymer-brush layer identified the presence of a relatively long-range effective repulsive force between the protein and the polymer layer extending out to a distance of about 10 Å from the polymer grafted layer surface.28 This work proposed that the long-range repulsive force resulted from the hydration layer, offering an additional clue about the nature of hydration layer in these polymers. Notably, this last work indicated the existence of a hydration layer extending well-beyond the immediate interfacial region around the polymer where the water structural organization structured is discernably altered from that of bulk water. The quantification of this less well-understood diffuse hydration layer is the priority of the present work.
It is becoming increasingly appreciated from accumulated studies of water-soluble polymers that hydration involves both a static hydration layer in the immediate proximity to the polymer moieties and a more extended vicinal or dynamical interfacial zone (i.e., dynamic hydration layer) in which the water dynamics are significantly altered from bulk water. Most quantitative studies of extended hydration layers have focused on proteins and lipid membranes so the generality of the phenomenon for other water-soluble polymers is currently unclear. Recent works25,26 have emphasized the possible complex synergistic effects between hydration with competing interactions that influence protein-protein interactions. For example, some studies25,29,30 have suggested a possible role where the dynamic hydration layer of some proteins reduces the entropic penalty for intermolecular association, a phenomenon that might also be operative in polyzwitterion polymers. This proposed entropic contribution has also been suggested in connection with co-ion interactions in simulations of polyelectrolyte association.31,32 The current limited fundamental understanding of hydration and appropriate hydration metrics of this phenomenon makes further quantification difficult.
It has often been claimed that proteins are related to polyzwitterions19,33 and accepting these arguments it is natural to compare the solution properties of proteins to zwitterionic polymers for common observational trends in both classes of polymers. It is generally appreciated, for example, that the extended hydration layer of proteins can actively facilitate protein binding and folding, phenomena of profound biophysical importance.34–40 Is there analogous behavior found in polyzwitterion polymer? The relatively high solvent mobility in the dynamic hydration layer on a ps timescale (THz frequency) has been found to be strongly coupled to the longer timescale conformational changes of proteins.35,40,41 This observation points to the potential importance of ps dynamics of the hydration layer in polyzwitterionic polymers. It has been suggested that the protein hydration layer can give rise to long-range interactions between the proteins in solution, allowing these macromolecules to “see” each other at relatively large distances and to regulate both their binding30 and targeted docking41,42.
Historically, the existence of an extended dynamic hydration layer was first observed in Terahertz (THz) spectroscopy measurements on protein solutions, where the protein concentration was gradually increased until collective effects were observed.40,43 The onset of these collective effects are interpreted to indicate a more rigid hydrogen bonding network44 and are considered to result from the overlap of protein dynamic hydration layers with a thickness from of 10 Å to 18 Å.40,43,45 These pioneering THz spectroscopy measurements probing the dynamic interfacial layers of proteins and other biological molecules,40,43,45,46 have since been extended to other measurement methods such as femtosecond-resolved fluorescence44 and dynamic neutron scattering47,48 that confirm the same qualitive picture of a dynamic hydration layer having a thickness on the order of a nm, as we find below in our simulations of polybetaines polymers in solution.
Simulations studies have supported THz spectroscopic measurements on protein solutions. These simulation studies indicated a dynamic hydration layer ranging from 10 Å up to 12 Å40,48,49, compared to spectroscopic estimations of a dynamic hydration thickness from 10 Å up to 18 Å40,43,45 for the proteins and solution conditions simulated. The methodology for identifying the dynamic hydration layer in these former simulations of protein solutions is rather involved and requires time-consuming computations, e.g., the calculation of the dipole/velocity autocorrelation function40,48,49, a property convoluted with the diffusion of the solvent.50,51 There is evidently a need for a more computationally economical approach to elucidating the mobility gradient and for identifying a metric of the extent of the dynamic hydration and the mobility gradient in this layer that can be more readily linked naturally to measurement. We address this general problem by developing a methodology applicable for estimating the extent of dynamic hydration layer of synthetic polymers such as polybetaines, as well as proteins and other biological macromolecules, and, moreover, this method even enables the direct and facile visualization of these layers in simulations of these polymer solutions. It is hoped that this methodology will provide the basis of a general-purpose metrology for better identifying and quantifying the hydration layers, allowing future studies to ascertain their effect on the properties of these solutions.
The connection between the ps timescale dynamics probed in THz spectroscopy measurements with processes occurring on much longer timescales requires some comment, even though this is not a new idea in either the protein 35,38–40 or polymer physics52,53 studies. In particular, the solvent dynamics on the timescale of a ps has been observed to be strongly correlated with protein conformational changes and changes of enzyme activity.35,38–40 In polymer physics, another connection between ps dynamics and relaxation / diffusion processes occurring on a vastly longer timescale where ps dynamic properties of the polymer fluid were found to be related to the -relaxation time, , obtained from the intermediate scattering function.52,53 In these works, the ps dynamics involved was the average mean squared atomic displacements of the polymer segments on a ps timescale (i.e., or the Debye-Waller parameter), suggesting that this quantity should be useful in quantifying the dynamics of the polybetaine hydration layer. Importantly, a similar correspondence between and has been observed for simulated bulk water,54 as well as diverse other liquids, ranging from polymeric and metallic glass-forming liquids.30,55–57 We then consider , which is at least readily measurable in bulk materials, as providing a suitable and easily computed metric for quantifying local mobility in the hydration layer and complex fluids generally.30,52–57 In a related pioneering work based on this idea, estimates for water molecules visualized the water mobility field around the amyloid fibers.30 Moreover, in previous work it has been observed that contributions to the vibrational density of states, corresponding to a ps timescale or THz frequency range, can be used to discern bound, unbound, and free water around a solvated enzyme.51 The present work is distinct from these previous works emphasizing fast THz dynamics in its focus on to quantify the mobility within the dynamic hydration layer around the polybetaine polymers. The advantage of is the computationally accessible of this metric for liquid mobility that can be measured experimentally by a variety of methods for the whole material and readily estimated by simulation. This property exhibits a strong correlative interrelationship to the rate of structural relaxation and diffusion processes occurring on much longer timescales.
This work utilizes all-atom molecular dynamics (AA-MD) to analyze the hydration layer of poly(3-[2-(acrylamido) ethyldimethylammonio] propanesulfonate) (PAEDAPS) with and without 100 mmol/L NaCl at several temperatures from 10 °C to 50 °C. We were initially motivated to simulate this polymer in 100 mmol/L solution, motivated by observations by Delgado and Schlenoff’58 in which a striking drop in the apparent of this polymer was reported with the addition of salt to the polymer solution, an effect attributed by them to a change in the polymer hydration layer. To allow for a feasible computation, the polybetaine molecule was represented as a 30-repeat unit chain to mitigate the effect of self-interactions that are prevalent in longer polymers that can greatly alter chain conformational structure. This constraint to relatively short chains allows us to focus on the solvation dynamics about the polymer, but limits study of interesting effects of how the chain dimensions are altered with the addition of salt, one of the outstanding questions about this class of polymers. We find that the addition of salt can significantly influence the dynamics within the polybetaine dynamic hydration layer. Moreover, we find that the dynamic hydration layer can be naturally decomposed into an interfacial region around the polymer backbone in which the water mobility is greatly influenced by the movement of the brush-like pendant groups of the polybetaine polymers, and an additional region beyond this layer in which the water mobility is significantly altered.
We begin by defining our methods in Section 2, followed our results in Section 3. Our work considers three solvent regimes about the polybetaines polymers, the first being bulk solvent. Second, there is water directly associated with the polymer pendant groups and corresponding we quantify the length scale of pendent group extension from the chain backbone in Section 3.1. We also estimated the probability distribution of the number of monatomic ions among the pendant groups at a particular moment in time because of their potential relevance to the intermolecular interactions of charged polymers, including polyzwitterions.31,32 The third regime represents the region between the bulk and space sampled by the polymer pendants, which is a vicinal region of dynamically altered water. In Section 3.2, we determined in order to define the transition from the vicinal region to the bulk solvent with the dynamic hydration layer overall thickness and the water mobility gradient within this layer. Section 3.3 characterizes the water residence time in the dynamic hydration layer, a quantity previously studied in connection with defining water strongly-bound to biomolecules.59 Because the variation in hydration stability with respect to changes in stimuli or chemistry are often attributed to changes in functional group stiffness,44,50,60 Section 3.4 uses the Debye-Waller parameter again to assess the influence of stimuli effects on polymer functional group mobility. Lastly, Section 3.5 includes the hydrogen bond analysis between the polybetaine and water, as this analysis of the static hydration layer is the standard methodology of probing hydration effects.27,44,60–66
2. Methodology
2.1. Simulation Details
This work models a polybetaine system with an atomistic molecular dynamics (MD) approach. Three independent boxes allowed for statistical analysis, and were built at each temperature and salt concentration with the MosDef‡ suite ( i.e., mbuild‡,67 and foyer‡,68). Each box then contains an independently generated atactic polymer (sequences shown in Section S1) with a thirty repeat unit degree of polymerization, solvated with 26 875 water molecules, and when applicable, 42 NaCl pairs. Water is represented with the transferable intermolecular potential four point model parametrized to include long range Ewald summations of charge interactions, i.e., the TIP4P-Ew model,69 and NaCl with the corresponding parameters for the Joung and Cheatham70 monovalent salts, which together serve as a prominent electrolyte model that is sufficiently representative of water dynamics and simultaneously spans the monatomic ion series. This choice will allow future comparison of this work with other salt combinations. However, TIP4P-Ew is known to slightly underperform in comparison to TIP4P/2005,71 which is equipped with a more limited series of ions72. The polybetaine, PAEDAPS, is modeled with the generalized forcefield, optimized potentials for liquid simulations (OPLS-AA)73,74 with the expansion of sulfonate parameters75. Ammonium parameters were obtained from the Enhanced Monte Carlo‡,76 package, in which they were included and substantiated through personal communication with the Jorgensen group. The parameters for the Joung and Cheatham ions and TIP4P-Ew water interact using Lorentz-Berthelot (LB) combining rules, while the OPLS-AA forcefield uses geometric combining rules. We then explicitly set the ion-water cross-interaction parameters according to the values obtained from the LB combining rules and adopted the geometric combining rules for interactions between OPLS-AA and TIP4P-Ew water or the ions. This strategy was recommended by Joung and Cheatham70 and substantiated with the use of their ion parameters for use with SPC/E water and the OPLS-AA forcefield in a recent work77. However, it should be recognized that studies involving the GAFF atomistic forcefield found that in aqueous solutions with organic ions and salt, the solvent structure was sensitive to specially tuned parameters,78 taking such system specific deviations into account could be considered with a nongeneralized forcefield in a future work.
Molecular dynamics simulations were carried out with the Large-scale Atomic/Molecular Massively Parallel Simulator (LAMMPS)‡,79 using periodic boundary conditions and 1 fs timesteps. Long-range electrostatics were treated using a particle-particle particle-mesh solver80 with a relative error of 0.0001. Three independent configurations for each temperature condition ranging from 10 °C to 50 °C in increments of 10 °C were equilibrated for 1.5 ns with constant temperature and atmospheric pressure (NPT at 101 325 Pa = 1 atm), the last 1 ns was used to calculate the equilibrium box size for subsequent simulations in the canonical ensemble (NVT), 93 Å. After 6 ns of equilibration, a 5 ns production run was used for the analysis in our work, as dynamic properties are most reliably represented in the NVE and NVT ensembles.81,82 This equilibration process is sufficient to reach an equilibrium state for the aqueous solution (structural relaxation of approximately 1 ps)83, without allowing conformational changes in the polymer to obfuscate our analysis the static hydration layer, as seen in Section S3 of the supplemental information. The Nose-Hoover thermostat and barostat were utilized with respective dampening factors of 100 °C and 1000 atm), where applicable. The trajectory was recorded every 10 fs for 50 ps for the total hydrogen bond lifetimes, and every 1 ps for 2 ns for intermittent hydrogen bond lifetimes and the entire production run for all other properties.
2.2. Analysis of Dynamic Properties
The results of this work were produced with MDAnalysis,‡,84,85 with the exception of partial radial distribution functions used for cutoff values, which were computed in LAMMPS. Of the results presented below, two aspects require further clarification. For the first aspect, Sections 3.1, 3.2, and 3.3 involve properties of atoms/molecules at some radial distance from the polymer backbone. Because the backbone moves, neither a cylindrical nor spherical shape is appropriate, thus an iso-layer selection method has been contributed to MDAnalysis to allow this flexible zone to be obtained, as depicted in Section S4. These radial metrics were used to define and discuss the extent of distributions of ions and the dynamic hydration layer to facilitate a contrast with metrics specific to the static hydration layer. Here we provide a visualization of the two hydrating components in Figure 1, the complement of this figure, defining the length scales involved is shown with our conclusions. The static hydration layer (1st hydration shell) is defined with a cut-off taken from the first minimum in the pair-correlation functions between hydrophilic species and water, leading to a tight surrounding layer in direct contact with the polybetaine. Similarly, the 2nd hydration shell is defined from the 2nd minima in the radial distribution function: the 1st and 2nd minima are tabulated in Section S8. The dynamic hydration layer is defined by a length scale radially distant from the backbone. Thus, the defining difference between these layers is that the static hydration layer is touching the polymer and the dynamic hydration layer experiences a hindered mobility from the influence of the polymer.
Figure 1:

Visualization of (a) polybetaine, (b) polymer with static hydration layer (1st hydration shell), (c) polymer with dynamic hydration layer, and (d) polymer with both static and dynamic hydration layer.
The static hydration layer (1st hydration shell, immediately adjacent to the hydrophilic moieties) and its response to changes in system conditions is traditionally studied with a hydrogen bond analysis (HBL). In particular, hydrogen bond analysis involves two quantities, the continuous and the intermittent lifetime which are respectively represented as:86,87
| (1) |
| (2) |
The function may assume a value of zero or one, where all hydrogen bonds present at are defined with a value of one. This value of unity is established at an instant that the same hydrogen bond exists, and is zero otherwise, thus the bond may break and reform. in Equation 1 retains a value of unity until the bond is broken, after which point it takes on a value of zero. Equation 1 then defines the continuous hydrogen bond lifetime (cHBL), while Equation 2 defines the intermittent hydrogen bond lifetime (iHBL). These two quantities given rise to different meanings, where the cHBL indicates the absolute stability of the bond, while the iHBL involves this stability in conjunction with diffusive properties thus representing the true length of a particular interaction. The decay curves resulting from this process were fit to two exponentials for both cHBLs and iHBLs, as the use of multiple exponentials has been needed to adequately capture the decay curve.60,64 Coupling between diffusion and hydrogen bond formation is at play in the static hydration layer, thought to be the microscopic reason behind the multiple relaxation modes.60 The prefactors of these exponentials then sum to one, so we have reported the overall characteristic time as a weighted average of the two relaxation times as is appropriate. The hydrogen bond of water is defined to have a donor-acceptor distance less than 3.5 Å with an angle between the vector created with the donor and hydrogen, and the hydrogen and acceptor restricted to an angle of 55°. This choice in angle is larger than what is traditionally used; the details of this choice are elaborated on in Section S7 of the supplemental information.
Section 3.3 shows the residence time of water and ions, radially distance from the backbone using the survival probability function in MDAnalysis. This option defines the residence time as:
| (3) |
where is the time window, and is the number of particles present in a group from timestep through timestep , this correlation is then averaged over the different starting points. This function allows a geometry based selection criteria, where we chose radial distances from the backbone, e.g., from 4 Å to 6 Å.
3. Results and Discussion
3.1. Distribution of Ionic Functional Groups and Monatomic Ions
To create an understanding of the ion landscape around the polymer, we obtained the distribution of key ionic pendant functional groups and monatomic ion distributions when relevant. First, we computed the distribution of normal distances between the polymer backbone and either the nitrogen atoms in ammonium or oxygen atoms in sulfonate. Figure 2 shows that the ammonium group distribution is much narrower than that of sulfonate, and neither are gaussian distributions. To quantitatively discuss their ranges, the bounding inflection points for the major features of the distribution in pure water at 10 °C were taken, as there is little variance in the range under the various system conditions. Thus, ammonium group ranges from 5.3 Å to 6.3 Å (Figure 2a) and sulfonate groups range from 3.6 Å to 10.5 Å away from the backbone (Figure 2b). We will define this latter maximum bound as , or the bound of major pendant extension, which will become relevant in Section 3.2. It is apparent that the sulfonate group samples a broad radial region (see also Section 3.4), interacting with both the amide group and ammonium groups represented by the first and second peaks, respectively. These interactions were confirmed with the radial distribution functions between sulfonate and ammonium provided in Figure S1. Although, these ranges do not significantly change with either temperature or with the addition of salt, the distribution of sampling shifts. An assessment of the radius of gyration for the polymer is included in Section S5 where we illustrate that the radius of gyration for this short chain polybetaine does not exhibit a statistically significant difference under any system conditions. This substantiates our assertion that this short 30-repeat unit chain serves to isolate the hydration effects of the polymer from the known stimuli response of chain dimensions to temperature and 100 mmol/L NaCl.
Figure 2:

Distribution of ionic functional group atoms normal to the backbone. (a) The nitrogen in quaternary ammonium, , with a schematic of the pendant group. (b) The oxygen in sulfonate, , with respect to their respective backbone atoms. Regions highlighted in yellow (larger area) and blue (central area) represent the ranges that sulfonate and ammonium traverse, respectively. Shaded regions represent the standard deviation over the three independent boxes.
In previous simulation studies involving the same ionic functional groups, but with a methacrylamide backbone and a slightly longer pendant, it was found that as the salt concentration increased, the cloud point increased to a maximum before declining.88 However, this same increase in ion concentration with a methacrylate backbone resulted in a monotonic decrease in cloud point. The nonmonotonic behavior for the methacrylamide correlated with the surface charge measured by the zeta-potential of the polymer, which is positive in pure water and decreased to zero for the maximum cloud point concentration before the polymer gained, and subsequently increased in negative charge. Because the methacrylate containing polymer exhibited a negative surface charge for all salt concentrations, these trends were taken to be correlated. Although a rationale involving Cl− penetration was stated in that work for the decrease in positive charge,88 the reason for a positive charge in pure water as a starting place was perplexing and still unexplained. We expect from our results that the propensity for sulfonate to interact with an amide backbone group in conjunction with the longer pendant group of that study might be the cause of a positive surface charge, as this interaction would result in exposed ammonium groups. An increase in the cloud point observed with the small addition of salt88 would then plausibly result from the replacement of self-pendant interactions with interactions among other parts of the same chain or from the collective effect of surrounding chains. Similar reasoning for the influence of salt has been proposed in other experimental studies.89–91 Considering the change in backbone and the increased length of the pendant, a study of that specific polymer and a more thorough analysis of relative binding energies is required for a firm stance to be asserted.
To better interpret these results, it is important to understand the distribution of monatomic ions interacting with the polymer pendant groups. We took an average of the charge due to monatomic ions at a cutoff value of from the PAEDAPS backbone to approximate the upper bound of extension exhibited by the pendant groups as shown in Figure 2. At 10 °C, the polymer contains a charge and standard deviation of where on average there are Na+ ions and Cl− ions. At 50 °C, these charges skew more positive at with the number of ions shifting to Na+ and Cl−. Such statistics suggest few direct interactions between ions within from the backbone and so little influence in surface charge with a similar average number of each ion. Notice, Figure 3 depicts the probability distribution for a given number of ions, where a box of our size at 100 mmol/L NaCl contains forty-two ion pairs. Figure 3c illustrates the charge average and captures the variation from −6 e up to 6 e. The averages reported in this work are dependent on our chosen forcefield; regardless it is apparent that there are fluctuations in polymer charge throughout the simulations, especially with fluctuations in Cl− ions at 10 °C.
Figure 3:

Probability distribution of monatomic ions and net charge at a particular moment in time within of the PAEDAPS backbone at the lowest and highest temperatures, 10 °C and 50 °C. The range in the x-axes represent the full range of the distributions. Uncertainty intervals represent the standard deviation over three independent simulation boxes, which reflect differences in polymer configuration shown in Section S5 which were not shown to significantly change at 10 °C in Figure S2.
3.2. Quantifying Dynamic Hydration with Radial Mobility Gradients via
We first recall previous works aimed at quantifying the dynamic hydration layer and the influence of this layer on the solution properties of proteins.40,43–45,92 One such example used the vibrational density of states (VDOS) of water around a protein to identify three types of water states: bound, weakly-associated, and unassociated or “free” water.51 The largest differentiating feature between these categories was the VDOS frequency range below 50 cm−1, corresponding to diffusion on the picosecond timescale and thus also to our chosen metric, . Furthermore, each of these states of water were found adjacent to even the most hydrophilic or hydrophobic of groups, despite a naïve expectation of clean separation of these proposed dynamical states. Thus, we elect to take an averaged approach to compare the various system conditions of this work. We then compute , the mean squared displacement at 1 ps, radially outward from the polymer backbone in iso-layers that change shape according to the flexibility of the backbone, the result of which is shown in Figure 4. These averages include a convolution of effects that arise from the polymer pendant groups. Our approach provides a means of discerning the extended dynamic hydration layer, while avoiding configurational complications. However, we deconvolute our results between the various types of interfacial solvent such as those within the static hydration layer (1st shell, Figure 4b), the second shell hydration layer (Figure 4c), and those that are not in either (Figure 4d, visualizations can be found in Figure 1). For 100 mmol/L solutions, the first hydration shells of monatomic ions are removed from the other categories as seen in Figure 4e. Here we show the results for the extremes of our temperature range, 10 °C and 50 °C for clarity. The mobility profiles at other temperatures can be found in Section S6 of the supplemental information.
Figure 4:
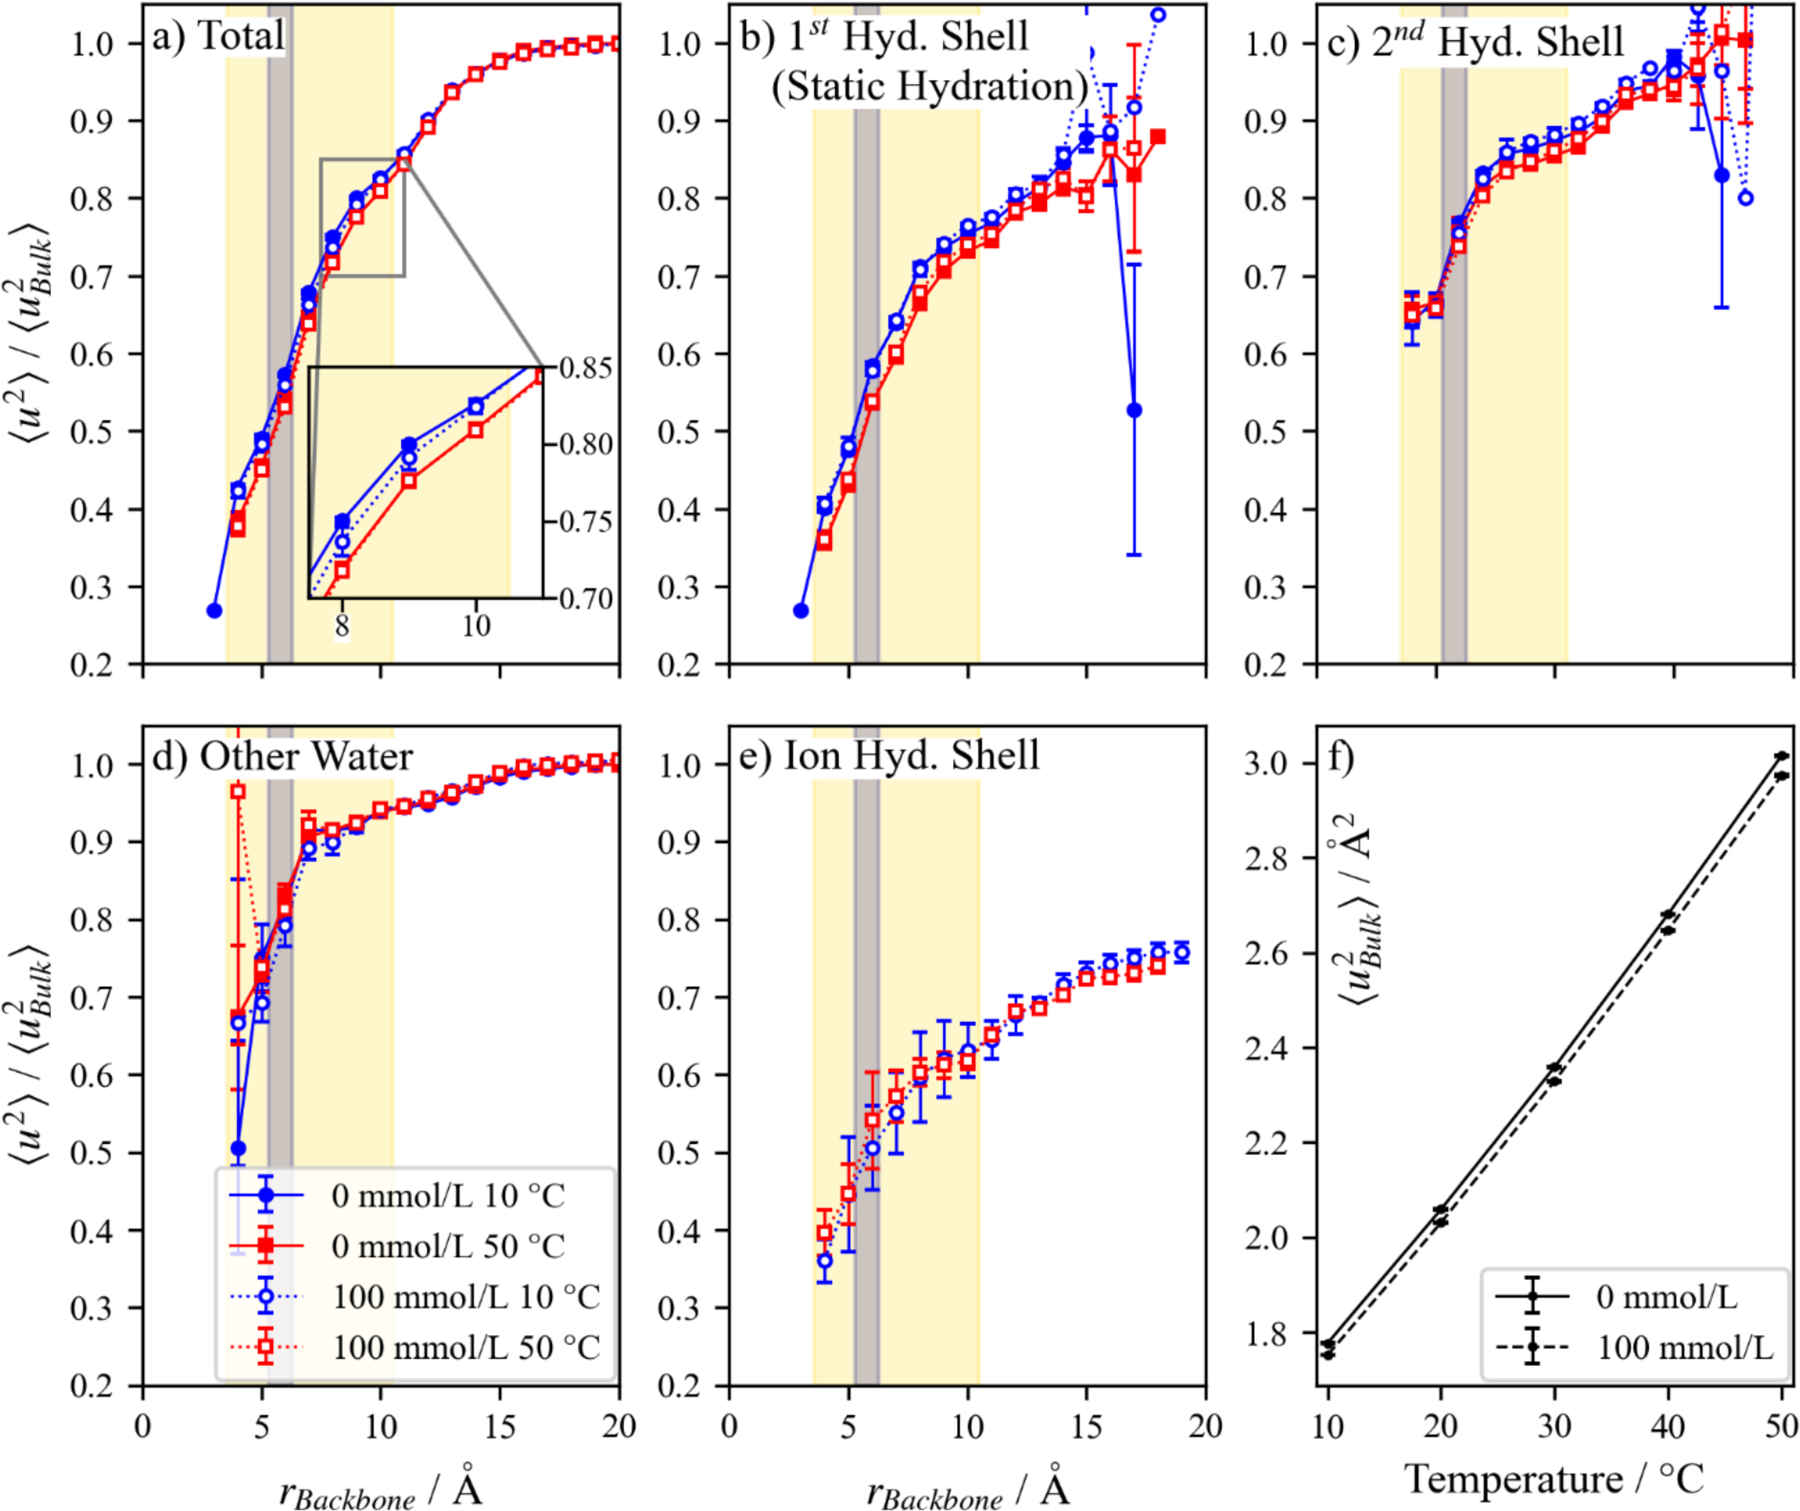
(a) Relative for all water at a radial distance from the backbone with varying change in stimuli. The mobility relative to the bulk of the (b) first hydration shell (see Figure 1b for visualization), (c) second hydration shell (within the second minimum of the partial pair distribution function for hydrophilic moieties), and (d) water that is not within two shells of hydration are shown. (e) To clarify the role of NaCl, the relative mobility of water in its first hydration layer was further separated. Although the change in as a function appears small in (a) because of the y-axis scale, (f) shows that there is an appreciable change in the for the bulk solution with respect to temperature. Regions highlighted in yellow (larger area) and blue (central area) represent the ranged that sulfonate and ammonium sample, respectively. Uncertainty intervals represent the standard deviation over three independent simulation boxes, where large uncertainties indicate a region with poor sampling of solvent molecules throughout the 5 ns trajectory or may be smaller than data markers.
Not surprisingly, the mobility of the bulk solvent varies dramatically with temperature, although this low salt concentration has a minimal effect. Figure 4f depicts the expected increase in solvent mobility as temperature increases, as well as the drop in mobility with the inclusion of 100 mmol/L NaCl which is known to increase the viscosity93 of water. It is apparent from Figure 4a–4d that proximity to the polymer backbone adds an additional effect on the solvent mobility. To compare these gradients for various system conditions, the data were scaled by their respective bulk solvent mobility values.
With this scaled perspective, it is apparent that close to the backbone the solvent mobility is 40 % of the bulk value, and the scaled mobility, , is between 0.83 and 0.85 at the extent of where sulfonate groups sample, . The mobility of solvent returns to the bulk solvent mobility when 18 Å from the backbone, which is consistent with the definition of the mobile interfacial layer in ice94 and crystalline Ni95. Thus the of water is generally suppressed near the polymer surface under the thermodynamic conditions that we study. A similar change in mobility relative to backbone proximity is observed in the static hydration layer. Notice the high relative mobility for water next to the exposed sulfonate groups, especially when compared to solvent that lies closer to the backbone. This observation accords with the conclusions of a simulation study of the hydration layer around DNA,66 where the static hydration layer was less stable for charged phosphate groups than polar groups shielded within DNA grooves. This destabilization of the hydration layer around charged groups was inferred to be due to its position exposed to the bulk solvent. The relative mobility of the second shell is higher (Figure 4c), ranging from 0.65 of the bulk value at 4 Å to approaching the bulk value at its greatest extent. Both the 1st and 2nd hydration layers (Figures 4b and 4c) can extend out to 16 Å from the backbone at 50 °C and 15 Å at 10 °C, which is significantly farther than (Section 3.1) and so represents the tail of the distribution shown in Figure 2b. However, the integrity of our chosen length scale is substantiated in Figure S7, where the fraction of each type of water depicted of Figure 4 demonstrates that the fraction of water within the static hydration layer dramatically drops below 10 % of the water beyond approximately 11 Å from the backbone, illustrating the low impact of the static hydration layer of the few sulfonate groups beyond the length scale, . The suppressed mobility extending beyond the 2nd hydration layer (Figure 4d) and to such a distance from the polymer (18 Å) illustrates the polybetaine’s effect on the surrounding solvent, even for this short chain. It is apparent from these profiles that the polymer effects the dynamics of water on a length scale that is larger than the static hydration layer (3 Å). For this work, we take the dynamic length scale, , to be the farthest extent, 18 Å, less the extent of the pendant groups leaving a dynamic length scale, .
When we more closely examine the effect of temperature changes and salt content on relative mobility profiles, unexpected trends emerge. First, the addition of 100 mmol/L NaCl and an increase in temperature both decreases the relative mobility. This change suggests that an increase in entropic disparity between dynamically altered water within the polymer and the bulk solvent accompanies an increase in temperature and the addition of salt. Such a temperature dependent trend is an aspect of the hydrophobic effect,96,97 as it pertains to entropy-enthalpy compensation, as the dynamic hydration layer is expected to contribute toward the entropy of solvation as discussed in the introduction. However, a decrease in the relative mobility may also be interpreted as an increase in stiffness,98 which is known to occur with the addition of salt99. Our choice to simulate relatively short chains to avoid excluded volume effects in our polymers precludes quantitative investigation of changes in the polymer dimensions due to salt or temperature. Further study should be made of whether the relative water mobility is reduced near the polymer backbone for other polybetaines, as both increases and decreases in mobility have been observed in coarse-grained simulations of the solvent mobility gradient around ions100 and in the polymer matrix around nanoparticles56, depending on the interaction of the surrounding fluid for the ions or nanoparticle, respectively.
3.3. Radial Dependence of Water Molecule Residence Time
With an understanding of the altered mobility experienced by the solvent surrounding PAEDAPS, we must assess the persistence time of solvent in this hindered state to conclude that this region can contribute to the apparent hydrodynamic size. To assess our dynamic hydration layer at an atomic resolution, we characterize the entrainment of water surrounding the polymer. We defined radial zones as iso-layers with a distance constraint from the polymer backbone, allowing the shape of the zone to change accordingly, and computed the continuous residence time in each zone. Figure 5 shows the continuous residence times of water and monatomic ions in these zones of 2 Å thickness, which represent the characteristic times for a molecule to leave a given region. The decay curve was determined using a trajectory written out every ps and fit to two exponential decay functions. The data represent the center of each zone, thus the sparce population of ionic functional groups close to the backbone (Section 3.1) suggests that sodium and chlorine do not spend a significant amount of time less than 5 Å from the backbone (Figure 5b and 5c).
Figure 5:

Continuous residence time of (a) water (where pure water is represented with solid lines and markers while 100 mmol/L with dashed lines and hollow markers), (b) chlorine ions, and (c) sodium in 2 Å radial zones relative to the polybetaine backbone. Regions highlighted in yellow (larger area) and blue (smaller area) represent the range that sulfonate and ammonium traverse, respectively. Regions with missing data resulted from a lack of sampling. Uncertainty intervals may be smaller than data markers.
In previous studies of the 1st shell hydration layer (static layer) of proteins, a continuous residence time above 10 ps was considered the threshold that defined strongly bound water.59 Only water at 10 °C reaches this threshold residence time. However, the precedent in defining a residence time for loosely-associating water molecules in comparison to bulk water does not exist. The residence time drops beyond the reach of ionic functional groups to within 5 % of the bulk water value after 16 Å at 10 °C and 14 Å at 50 °C (Figure 5a). This length scale suggests the entrainment of water beyond the reach of sulfonate groups (10.5 Å defined in Section 3.1), approximately represented in Figure 6d. If one set an absolute cutoff requiring a characteristic time for water of at least 5 ps, this would occur 8 Å from the backbone at 10 °C and 6 Å at 50 °C (Figure 6c). These length scales are then visually compared to hydration shell within 18 Å, as obtained in Section 3.2, where the mobility of water returns to bulk values (Figure 6e).
Figure 6:

Polybetaine with variations in hydration represented as isosurface. The first two structures represent: (a) the bare polymer, (b) the polymer with its static hydration shell determined from water with some cutoff distance from each hydrophilic atomic species. The following structures (c-e) indicate what the dynamic hydration layer would look like at various cutoff values from the backbone. The longest extension of sulfonate groups in the pendants is (Section 3.1). The mobility of water, quantified in Section 3.2, returns to the bulk value at 18 Å. These isosurface representations were generated with the package, Visualization Molecular Dynamics (VMD)92 with a density cut off of 0.1 atoms / Å3 to illustrate an encasing zone.
Overall, the residence time of Na+, 5 Å from the backbone is more than 50 % higher than Cl− or water at 10 °C. This corresponds to the higher diffusion coefficient of chlorine in water compared to sodium.101 While Cl− exhibits its longest continuous residence time in the ammonium region at 10 °C (as expected), this interaction is lessened at 50 °C. Notably, there is no increased sampling close to the backbone at higher temperature as proposed in the study of a methacrylamide containing polybetaine’s salt dependence on the cloud point88 (see Section 3.1).
3.4. Mobility of Betaine Moieties
Much of the simulation-based literature suggests that stiffer polymer groups lead to reduced stability of the solvent layer.44,50,60 We expect that a change in strength of pendant interactions will result in an inverse change of polybetaine mobility. For example, if salt has a screening effect to disrupt pendant group interactions, the mobility of the pendants should increase. However, if salt is interacting with the pendants or if the density / viscosity of the system increases, a decrease in solvent mobility should be observed. To investigate these hypotheses, we calculated for each of the central functional groups of PAEDAPS, namely, the carbonyl carbon of the amide group, the nitrogen of ammonium, and the sulfur of sulfonate. Figure 7 shows that the mobility of the functional groups decreases as their relative degree of separation from the backbone decreases, with no change in the presence of 100 mmol/L NaCl. This relationship between functional group mobility and degree of separation from the backbone and the effect of temperature corresponds to the changes observed in bulk water mobility (Figure 4f). This suggests that at this salt concentration, polymer-salt interactions do not play a large enough role to stiffen the pendant group, while Section 3.2 showed an increase in relative stiffness of the solvent when compared to the bulk. The effect of temperature can be understood from the perspective of a simulation study where an infinitely stiff protein dampened solvent mobility, as their interactions were longer lived, in comparison to the standard flexible model.50
Figure 7:

The mobility of betaine functional groups represented from key atoms: the carbonyl carbon in amide group, nitrogen in ammonium, and sulfur in sulfonate. The mobilities of these atoms are compared between solution conditions of pure water (solid line and markers) and 100 mmol/L NaCl (dashed line and hollow markers). Uncertainty intervals represent the 95% confidence intervals over three independent simulation boxes.
3.5. Hydrogen Bond Lifetime Analysis
Simulation-based studies have yielded substantial insight into the static hydration layer, which was the focus of most simulation-based studies of hydration.27,44,60–66 Thus, we must assess the hydration layer with traditional means to compare our new understanding of how mobility gradients elucidate the dynamic hydration layer’s response to temperature and salt. We chose the popular Hydrogen Bond Lifetime (HBL) analysis method to study the static hydration layer of PAEDAPS, which represents the first hydration shell of water that is adjacent to hydrophilic polymer functional groups. Figure 8 illustrates the change in characteristic times for both cHBLs and iHBLs (Section 2.2) concerning temperature variation under two conditions: pure water and 100 mmol/L NaCl. A hydrogen bond is defined to have a donor-acceptor distance that is less than 3.5 Å with an angle between the vector created with the donor and hydrogen and the hydrogen and acceptor restricted to an angle of 55°. This choice in angle is larger than what is traditionally used; the details of this choice are elaborated on in Section S7 of the supplemental information. In Figure 8, the hydrogen bond donor and hydrogen atom are labeled first in parenthesis, and the acceptor is listed second. Notice we included hydrogen bonds from hydrogen atoms with a second-degree connection to ammonium, which are known from experiments to be comparable in strength to alcohol hydrogen bonds.102
Figure 8:

Hydrogen bond lifetimes between polybetaine, PAEDAPS, and water. The top row represents the continuous lifetime with the characteristic timescale before breaking the bond. The second row represents the intermittent lifetime where the interaction can come and go until that interaction no longer occurs due to diffusion. The solid lines (–) indicate characteristic times in pure water, while the dashed lines (--) indicate 100 mmol/L NaCl is present. Uncertainty intervals represent standard deviation from three independent simulation trajectories and may be smaller than data markers.
As one might expect, the ammonium cHBLs with water are significantly shorter lived than hydrogen bonds between the solvent with other hydrophilic polymer moieties, although the difference between ammonium-water cHBLs and the cHBLs with other polymeric groups differ by two orders of magnitude. In Section S7 we discussed that these results are heavily impacted by the choice in geometric constraints. Here we differentiate between the sp2 and sp3 ammonium methylene groups, showing that sp2 groups in the pendant’s backbone show lower cHBLs compared to the sp3 methyl groups (Figure 8b). The cHBL of water with the sulfonate group at the end of the pendant group (Figure 8a) is more comparable in order of magnitude with the HBL expected between water molecules, i.e., ≈ 1.3 ps61,62 and are comparable to the hydration of the anionic surfactant sodium bis(2-ethyl-1-hexyl) sulfosuccinate (AOT) where the cHBL was found to be 1.5 ps and 19.9 ps for the iHBL at 25 °C.64 In a study comparing the hydration dynamics of glycine’s dimethyl- and trimethylated analogues, the cHBLs were found to be sensitive to clustering.27 It was suggested that although water remains adjacent to trimethyl glycine in a condensed scenario, solvent readily transitions to bonding with another closely available hydrogen atom. This effect has also been shown in simulations of phosphate lipid bilayers where HBLs were compared between a pure water solvent and a mixed water/ethanol solution.65 The cHBL between water and phosphate groups decreased from 2.8 ps to 2.2 ps with the introduction of ethanol, and the iHBL decreased from 81 ps to 59 ps. We expect that this behavior may cause the low cHBLs of ammonium, and indeed when reformation is allowed, as in iHBLs, the dramatic difference between ammonium and the other hydrogen bonding groups disappears (Figure 8c and 8d). A combination of strong hydrogen bonding species with hindered diffusion may be at play with the formation of bridged structures bonded to multiple species simultaneously, as can be the case with protein helices.103
Because our iHBLs are an order of magnitude higher than reported in other works, we expect diffusion limitations and changes in stiffness for the polymer environment to be at play within the brushy pendant groups of PAEDAPS. In a study of water dynamics around peptides, the iHBLs of the static hydration layer were in the range of 25 ps to 50 ps for uncharged moieties.60,63 Although this study differs to our study in the water model (TIP3P) considered, and sets stricter geometric constraints (cutoff distance of 3.3 Å and angle of 35°). Notably, those simulations involved only two alpha helices in solution60 and even that relatively unrestricted solvent environment, with relatively stiff peptide segments, resulted in higher water residence times. A study on the hydration of apomyoglobin with femtosecond fluorescence in conjunction with MD also indicated that an decrease in structural flexibility would increase the relaxation time.44 Given that our iHBLs are an order of magnitude higher that these other works, we expect that the environment within betaine pendant groups suffers from the same encumbrance. Especially given that the iHBLs of the amide backbone are greater than those between water and the charged functional groups. Just as in a study of DNA static hydration indicated that the HBLs between phosphate and water were lower than for nonionic groups in the major and minor grooves of duplex DNA, an effect interpreted as being due to the prevalent solvent exposure for the DNA phosphate groups.66
It is apparent that there is a consistent impact of temperature on the characteristic timescales associated with the static hydration layer, and an increase in HBL with the influence of salt under most conditions. With higher residence times when 100 mmol/L NaCl (dashed line) is included for iHBLs between water and both sulfonate and ammonium methyl groups at lower temperatures, we determine that the static hydration layer becomes more stable. If the ions are spending a significant amount of time among the pendant groups (Section 3.4), then this result may indicate the hydrogen-bond bridge scenario, although there is on average a single monatomic ion of each type (Section 3.1). Such a stable hydration layer corresponds to our expectation of good solvent that interrupts pendant-pendant interactions. An increase in temperature reduces the lifetime, as thermal energy overcomes this interaction leading to a more flexible polymer as expected.
4. Conclusions
Polybetaine materials are known to exhibit changes in mechanical and structural properties in response to stimuli such as temperature and salt type / concentration. In this work, we applied all-atom molecular dynamics to study a thirty-repeat unit, atactic chain of poly(3-[2-(acrylamido) ethyldimethylammonio] propanesulfonate) with and without 100 mmol/L NaCl from 10 °C to 50 °C in increments of 10 °C. Here we studied the static and dynamic hydration layers with traditional and emerging analyses. Then to gain a better perspective of the charged landscape that heavily influence these changes, the distributions of ionic functional groups and monatomic ions provided insight.
The average location of ions in PAEDAPS were established with the distribution of ionic polymer functional groups and monatomic ions relative to the backbone (Section 3.1). The radial range of the ionic functional groups with respect to the backbone did not change with increased temperature or the introduction of salt and the radius of gyration did not change in a statistically meaningful way with changes in thermodynamic conditions (Section S5) suggesting that our choice to simulate relatively short chains to avoid excluded volume effects was successful. However, the variation in chain dimensions for individual boxes (Figure S6) suggests that strong ionic functional group interactions would require sampling at significantly longer timescale than the 5 ns used in this work. Nonetheless, the distribution of sulfonate oxygen atoms relative to the backbone provided a limit of 10.5 Å for reasonable pendant extension. The lower bound of sulfonate sampling at 3.6 Å illustrates that a fraction of the sulfonate groups are buried among the pendants rather than outward facing. Such pendant configurations may explain the positive zeta-potential observed in a related polybetaine with a methacrylamide backbone (discussed in Section 3.1). Although the origin of the positive charge in pure water was left unknown, that work supposed that chlorine may be interacting with the amide backbone groups to decrease the positive charge, which was not supported by our assessment of ion residence times in Section 3.3 or probability densities of ions within the polymer pendants in Section 3.1, as the average number of both Na+ and Cl− is approximately one ion within the bound of pendant extension, (Section 3.1).
We assessed the response of the static hydration layer to stimuli with a traditional hydrogen bond lifetime analysis of solvent/polymer interactions. The static hydration layer becomes less stable with increasing temperature, as evidenced by lower intermittent hydrogen bond lifetimes (Section 3.5). There was a slight increase in HBLs with the inclusion of salt. There is a well-established relationship where a stiffer polymer results in increased HBLs, however, the relative mobility of the polymer functional groups did not change with the inclusion of 100 mmol/L NaCl (Section 3.4). Nonetheless, our continuous HBLs are an order of magnitude higher than those listed in the literature for nonionic functional groups. Thus, the stronger static hydration layer expected of polybetaines to create a protective barrier essential for anti-fouling applications is present, however, that feature is thought to be derived from vicinal hydrating water, rather than the static hydration layer which is defined to be within approximately of hydrogen bonding moieties.
In our study of the static hydration layer, the continuous hydrogen bond lifetime was extraordinarily short, while the intermittent lifetime was comparable to other functional groups. Other studies have suggested that multiple hydrogen bond acceptors in close proximity can lead to such decreases in the continuous lifetime, cHBL, while not necessarily representing an increase in diffusion from the site. Our continuous residence time calculations support this where in the region around ammonium groups, the solvent experiences a maximum in the residence time that is well above the cHBL for ammonium, substantiating that the competing presence of positive hydrogen atoms in ammonium serve to decrease the cHBL without representing a decreased interaction time between water and ammonium.
Extended hydration layers have previously been studied with simulation methods for a variety of charged biomacromolecules, however, the methods used in the literature to date that can discern the dynamic hydration layer are computationally intensive. We show an efficient way to quantify the dynamic hydration layer via simulation through a mobility metric, , defined as the mean-square displacement at a timescale on the order of 1 ps. Notably, at a characteristic time on the order of the fast -relaxation of water104 has been related to the -relation time for water and many other complex fluids, and so serves a simple means of quantifying mobility in relation to the rate of structural relaxation and diffusion. The presence of a larger dynamic hydration layer when compared to the hydration captured by static properties has been previously established.105 Conclusions drawn from changes in absolute solvent mobility align with those drawn from HBL analysis with respect to changes in temperature and the inclusion of salt. While the introduction of 100 mmol/L NaCl does not significantly change the mobility (i.e., stiffness) of the polymer functional groups (Figure 7), it does reduce the bulk solvent mobility (Figure 4e) as well as the relative mobility within the pendant groups (Figure 4a). Regardless of these stimuli, a gradient of hindered mobility was quantified with to extend to 18 Å from the backbone, thus capturing a property of PAEDAPS that is not apparent using static metrics like the number density or the tetrahedral order parameter (Section S9). Indeed, with the limit of major pendant sampling at , there is representing purely dynamically altered water, as less than 10% of this region represents the static hydration layer after 11 Å from the PAEDAPS backbone (Figure S7). The basic findings of the present work are schematically visualized in Figure 9 to emphasize our main points. This work views the hydration layer as a region taken from the polymer backbone rather than in terms of hydration layers. Figure 4 illustrates mobility gradient within hydration layer definitions as well as entrained water among the brushy pendant groups beyond the 1st and 2nd hydration layers that converge to bulk mobility values at a characteristic length from the backbone, .
Figure 9:

Depiction of hydration layer contributions from the backbone at the bottom, extending through configurations of pendant groups , continuing through dynamically altered water , to the bulk solvent at 18 Å. The impact of the simplified depiction in this figure is more accurately represented with a flexible backbone in Figure 1. This figure is not to scale.
In the process of illustrating our new method of analyzing the dynamic hydration layer with the Debye-Waller parameter, this work has revealed several atomistic level insights into polybetaine systems, including our observation of nonergodic behavior on the ns timescale. While our simulation strategy has provided a demonstration of this insight, future works of this nature that compare the dynamic hydration of varying chemistries, might consider creating a simulation box with cylindrical symmetry were the polymer is infinitely long through its periodic image.106
Supplementary Material
Acknowledgments
Computer time was provided by National Institute of Standards and Technology (NIST). J.A.C. acknowledges partial support by the National Research Council-NIST Postdoctoral Fellowship Program.
Footnotes
Publisher's Disclaimer: Official contribution of the National Institute of Standards and Technology; not subject to copyright in the United States
Supplemental Information
See the supplemental information for the sequence of enantiomers for each box, radial distribution functions for pendant interactions, and a comparison of dynamic hydration profiles at 10 °C to substantiate production run times. A visualization of nested iso-layers is included for clarity in understanding iso-surface calculations. We show evidence that the radius of gyration for our thirty-unit PAEDAPS chain illustrates a lack of statistically significant change with respect to stimuli, although the distributions leading to these values provides more insight. The additional mobility profiles of other temperatures are provided for a fuller picture. Heat maps of the geometric distributions used in hydrogen bond analysis supplement a discussion on our generous constraints for hydrogen bond analysis followed by the first and second minima of the pair correlation functions between the hydrophilic polymer atoms and water. The radial number density and tetrahedral order parameter distributions close to and far from the backbone for water illustrate that capturing the extent of the dynamic hydration layer is limited to the mobility metric used in this work and cannot be replicated with static quantities.
Certain commercial equipment, instruments, or materials are identified in this paper to foster understanding. Such identification does not imply recommendation or endorsement by the National Institute of Standards and Technology, nor does it imply that the materials or equipment identified are necessarily the best available for the purpose.
Author Declarations
Authors declare no conflict of interest.
References
- (1).Zhang L; Cao Z; Bai T; Carr L; Ella-Menye J-R; Irvin C; Ratner BD; Jiang S Zwitterionic Hydrogels Implanted in Mice Resist the Foreign-Body Reaction. Nat. Biotechnol 2013, 31 (6), 553–556. 10.1038/nbt.2580. [DOI] [PubMed] [Google Scholar]
- (2).Wang T; Deng J; Ran R; Shi W; Gao Y; Ren X; Cao J; Zhang M In-Situ Forming PEG-Engineering Hydrogels with Anti-Fouling Characteristics as an Artificial Vitreous Body. Chem. Eng. J 2022, 449, 137486. 10.1016/j.cej.2022.137486. [DOI] [Google Scholar]
- (3).Venault A; Zhou R-J; Galeta TA; Chang Y Engineering Sterilization-Resistant and Fouling-Resistant Porous Membranes by the Vapor-Induced Phase Separation Process Using a Sulfobetaine Methacrylamide Amphiphilic Derivative. J. Membr. Sci 2022, 658, 120760. 10.1016/j.memsci.2022.120760. [DOI] [Google Scholar]
- (4).Wei J; Helm GS; Corner-Walker N; Hou X Characterization of a Non-Fouling Ultrafiltration Membrane. Desalination 2006, 192 (1–3), 252–261. 10.1016/j.desal.2005.06.049. [DOI] [Google Scholar]
- (5).Chiang Y-C; Chang Y; Higuchi A; Chen W-Y; Ruaan R-C Sulfobetaine-Grafted Poly(Vinylidene Fluoride) Ultrafiltration Membranes Exhibit Excellent Antifouling Property. J. Membr. Sci 2009, 339 (1–2), 151–159. 10.1016/j.memsci.2009.04.044. [DOI] [Google Scholar]
- (6).Zhang Z; Chen S; Chang Y; Jiang S Surface Grafted Sulfobetaine Polymers via Atom Transfer Radical Polymerization as Superlow Fouling Coatings. J. Phys. Chem. B 2006, 110 (22), 10799–10804. 10.1021/jp057266i. [DOI] [PubMed] [Google Scholar]
- (7).Fujii S; Takano S; Nakazawa K; Sakurai K Impact of Zwitterionic Polymers on the Tumor Permeability of Molecular Bottlebrush-Based Nanoparticles. Biomacromolecules 2022, 23 (7), 2846–2855. 10.1021/acs.biomac.2c00216. [DOI] [PubMed] [Google Scholar]
- (8).Zhao D; Rajan R; Yusa S; Nakada M; Matsumura K Development and Structural Analysis of Dual-Thermo-Responsive Self-Assembled Zwitterionic Micelles. Mater. Adv 2022, 3 (10), 4252–4261. 10.1039/D1MA01189H. [DOI] [Google Scholar]
- (9).Cayre OJ; Chagneux N; Biggs S Stimulus Responsive Core-Shell Nanoparticles: Synthesis and Applications of Polymer Based Aqueous Systems. Soft Matter 2011, 7 (6), 2211–2234. 10.1039/C0SM01072C. [DOI] [Google Scholar]
- (10).Wang D; Wu T; Wan X; Wang X; Liu S Purely Salt-Responsive Micelle Formation and Inversion Based on a Novel Schizophrenic Sulfobetaine Block Copolymer: Structure and Kinetics of Micellization. Langmuir 2007, 23 (23), 11866–11874. 10.1021/la702029a. [DOI] [PubMed] [Google Scholar]
- (11).Yang B; Wang C; Zhang Y; Ye L; Qian Y; Shu Y; Wang J; Li J; Yao F A Thermoresponsive Poly(N-Vinylcaprolactam-Co-Sulfobetaine Methacrylate) Zwitterionic Hydrogel Exhibiting Switchable Anti-Biofouling and Cytocompatibility. Polym. Chem 2015, 6 (18), 3431–3442. 10.1039/C5PY00123D. [DOI] [Google Scholar]
- (12).Saha P; Santi M; Emondts M; Roth H; Rahimi K; Großkurth J; Ganguly R; Wessling M; Singha NK; Pich A Stimuli-Responsive Zwitterionic Core–Shell Microgels for Antifouling Surface Coatings. ACS Appl. Mater. Interfaces 2020, 12 (52), 58223–58238. 10.1021/acsami.0c17427. [DOI] [PubMed] [Google Scholar]
- (13).You M; Wang P; Xu M; Yuan T; Meng J Fouling Resistance and Cleaning Efficiency of Stimuli-Responsive Reverse Osmosis (RO) Membranes. Polymer 2016, 103, 457–467. 10.1016/j.polymer.2016.03.065. [DOI] [Google Scholar]
- (14).Zhang X; Tian J; Gao S; Shi W; Zhang Z; Cui F; Zhang S; Guo S; Yang X; Xie H; et al. Surface Functionalization of TFC FO Membranes with Zwitterionic Polymers: Improvement of Antifouling and Salt-Responsive Cleaning Properties. J. Membr. Sci 2017, 544, 368–377. 10.1016/j.memsci.2017.09.044. [DOI] [Google Scholar]
- (15).Zhao Y-H; Wee K-H; Bai R A Novel Electrolyte-Responsive Membrane with Tunable Permeation Selectivity for Protein Purification. ACS Appl. Mater. Interfaces 2010, 2 (1), 203–211. 10.1021/am900654d. [DOI] [PubMed] [Google Scholar]
- (16).Birkner M; Ulbricht M Ultrafiltration Membranes with Markedly Different pH - and Ion-Responsivity by Photografted Zwitterionic Polysulfobetain or Polycarbobetain. J. Membr. Sci 2015, 494, 57–67. 10.1016/j.memsci.2015.07.046. [DOI] [Google Scholar]
- (17).Lowe AB; McCormick CL Synthesis and Solution Properties of Zwitterionic Polymers. Chem. Rev 2002, 102 (11), 4177–4190. 10.1021/cr020371t. [DOI] [PubMed] [Google Scholar]
- (18).Dong D; Li J; Cui M; Wang J; Zhou Y; Luo L; Wei Y; Ye L; Sun H; Yao F In Situ “Clickable” Zwitterionic Starch-Based Hydrogel for 3D Cell Encapsulation. ACS Appl. Mater. Interfaces 2016, 8 (7), 4442–4455. 10.1021/acsami.5b12141. [DOI] [PubMed] [Google Scholar]
- (19).Zhang Y; Liu Y; Ren B; Zhang D; Xie S; Chang Y; Yang J; Wu J; Xu L; Zheng J Fundamentals and Applications of Zwitterionic Antifouling Polymers. J. Phys. Appl. Phys 2019, 52 (40), 403001. 10.1088/1361-6463/ab2cbc. [DOI] [Google Scholar]
- (20).Pickett PD; Ma Y; Lueckheide M; Mao Y; Prabhu VM Temperature Dependent Single-Chain Structure of Poly[3-(Acrylamidopropyl-Dimethyl-Ammonium) Propyl-1-Sulfonate] via Small-Angle Neutron Scattering. J. Chem. Phys 2022, 156 (21), 214904. 10.1063/5.0093158. [DOI] [PubMed] [Google Scholar]
- (21).Seuring J; Agarwal S Polymers with Upper Critical Solution Temperature in Aqueous Solution. Macromol. Rapid Commun 2012, 33 (22), 1898–1920. 10.1002/marc.201200433. [DOI] [PubMed] [Google Scholar]
- (22).Huang X; Mutlu H; Lin S; Theato P Oxygen-Switchable Thermo-Responsive Polymers with Unprecedented UCST in Water. Eur. Polym. J 2021, 142, 110156. 10.1016/j.eurpolymj.2020.110156. [DOI] [Google Scholar]
- (23).Daniel D; Chia AYT; Moh LCH; Liu R; Koh XQ; Zhang X; Tomczak N Hydration Lubrication of Polyzwitterionic Brushes Leads to Nearly Friction- and Adhesion-Free Droplet Motion. Commun. Phys 2019, 2 (1), 105. 10.1038/s42005-019-0205-x. [DOI] [Google Scholar]
- (24).Chen M; Briscoe WH; Armes SP; Klein J Lubrication at Physiological Pressures by Polyzwitterionic Brushes. Science 2009, 323 (5922), 1698–1701. 10.1126/science.1169399. [DOI] [PubMed] [Google Scholar]
- (25).Zhang H; Zheng J; Lin C; Yuan S Molecular Dynamics Study on Properties of Hydration Layers above Polymer Antifouling Membranes. Molecules 2022, 27 (10), 3074. 10.3390/molecules27103074. [DOI] [PMC free article] [PubMed] [Google Scholar]
- (26).Zhang H; Zheng J; Lin C; Yuan S Molecular Dynamics Study on Adsorption and Desorption of Lysozyme above Polymer Antifouling Membranes. Colloids Surf. Physicochem. Eng. Asp 2022, 649, 129466. 10.1016/j.colsurfa.2022.129466. [DOI] [Google Scholar]
- (27).White A; Jiang S Local and Bulk Hydration of Zwitterionic Glycine and Its Analogues through Molecular Simulations. J. Phys. Chem. B 2011, 115 (4), 660–667. 10.1021/jp1067654. [DOI] [PubMed] [Google Scholar]
- (28).He Y; Hower J; Chen S; Bernards MT; Chang Y; Jiang S Molecular Simulation Studies of Protein Interactions with Zwitterionic Phosphorylcholine Self-Assembled Monolayers in the Presence of Water. Langmuir 2008, 24 (18), 10358–10364. 10.1021/la8013046. [DOI] [PubMed] [Google Scholar]
- (29).Conti Nibali V; Havenith M New Insights into the Role of Water in Biological Function: Studying Solvated Biomolecules Using Terahertz Absorption Spectroscopy in Conjunction with Molecular Dynamics Simulations. J. Am. Chem. Soc 2014, 136 (37), 12800–12807. 10.1021/ja504441h. [DOI] [PubMed] [Google Scholar]
- (30).Fichou Y; Schirò G; Gallat F-X; Laguri C; Moulin M; Combet J; Zamponi M; Härtlein M; Picart C; Mossou E; et al. Hydration Water Mobility Is Enhanced around Tau Amyloid Fibers. Proc. Natl. Acad. Sci 2015, 112 (20), 6365–6370. 10.1073/pnas.1422824112. [DOI] [PMC free article] [PubMed] [Google Scholar]
- (31).Rathee VS; Sidky H; Sikora BJ; Whitmer JK Role of Associative Charging in the Entropy–Energy Balance of Polyelectrolyte Complexes. J. Am. Chem. Soc 2018, 140 (45), 15319–15328. 10.1021/jacs.8b08649. [DOI] [PubMed] [Google Scholar]
- (32).Ou Z; Muthukumar M Entropy and Enthalpy of Polyelectrolyte Complexation: Langevin Dynamics Simulations. J. Chem. Phys 2006, 124 (15), 154902. 10.1063/1.2178803. [DOI] [PubMed] [Google Scholar]
- (33).Pickett PD; Ma Y; Posey ND; Lueckheide M; Prabhu VM Structure and Phase Behavior of Polyampholytes and Polyzwitterions. In Macromolecular Engineering; Hadjichristidis N, Gnanou Y, Matyjaszewski K, Muthukumar M, Eds.; Wiley, 2022; pp 1–51. 10.1002/9783527815562.mme0056. [DOI] [Google Scholar]
- (34).Woods KN The Glassy State of Crambin and the THz Time Scale Protein-Solvent Fluctuations Possibly Related to Protein Function. BMC Biophys 2014, 7 (1), 8. 10.1186/s13628-014-0008-0. [DOI] [PMC free article] [PubMed] [Google Scholar]
- (35).Ringe D; Petsko GA The ‘Glass Transition’ in Protein Dynamics: What It Is, Why It Occurs, and How to Exploit It. Biophys. Chem 2003, 105 (2–3), 667–680. 10.1016/S0301-4622(03)00096-6. [DOI] [PubMed] [Google Scholar]
- (36).Paciaroni A; Cornicchi E; Marconi M; Orecchini A; Petrillo C; Haertlein M; Moulin M; Sacchetti F Coupled Relaxations at the Protein–Water Interface in the Picosecond Time Scale. J. R. Soc. Interface 2009, 6 (suppl_5). 10.1098/rsif.2009.0182.focus. [DOI] [PMC free article] [PubMed] [Google Scholar]
- (37).Jansson H; Bergman R; Swenson J Role of Solvent for the Dynamics and the Glass Transition of Proteins. J. Phys. Chem. B 2011, 115 (14), 4099–4109. 10.1021/jp1089867. [DOI] [PubMed] [Google Scholar]
- (38).Doster W The Protein-Solvent Glass Transition. Biochim. Biophys. Acta BBA - Proteins Proteomics 2010, 1804 (1), 3–14. 10.1016/j.bbapap.2009.06.019. [DOI] [PubMed] [Google Scholar]
- (39).Heyden M; Sun J; Funkner S; Mathias G; Forbert H; Havenith M; Marx D Dissecting the THz Spectrum of Liquid Water from First Principles via Correlations in Time and Space. Proc. Natl. Acad. Sci 2010, 107 (27), 12068–12073. 10.1073/pnas.0914885107. [DOI] [PMC free article] [PubMed] [Google Scholar]
- (40).Ebbinghaus S; Kim SJ; Heyden M; Yu X; Heugen U; Gruebele M; Leitner DM; Havenith M An Extended Dynamical Hydration Shell around Proteins. Proc. Natl. Acad. Sci 2007, 104 (52), 20749–20752. 10.1073/pnas.0709207104. [DOI] [PMC free article] [PubMed] [Google Scholar]
- (41).Fenimore PW; Frauenfelder H; McMahon BH; Young RD Bulk-Solvent and Hydration-Shell Fluctuations, Similar to α- and β-Fluctuations in Glasses, Control Protein Motions and Functions. Proc. Natl. Acad. Sci 2004, 101 (40), 14408–14413. 10.1073/pnas.0405573101. [DOI] [PMC free article] [PubMed] [Google Scholar]
- (42).Xu Y; Havenith M Perspective: Watching Low-Frequency Vibrations of Water in Biomolecular Recognition by THz Spectroscopy. J. Chem. Phys 2015, 143 (17), 170901. 10.1063/1.4934504. [DOI] [PubMed] [Google Scholar]
- (43).Born B; Kim SJ; Ebbinghaus S; Gruebele M; Havenith M The Terahertz Dance of Water with the Proteins: The Effect of Protein Flexibility on the Dynamical Hydration Shell of Ubiquitin. Faraday Discuss 2009, 141, 161–173. 10.1039/B804734K. [DOI] [PubMed] [Google Scholar]
- (44).Zhang L; Yang Y; Kao Y-T; Wang L; Zhong D Protein Hydration Dynamics and Molecular Mechanism of Coupled Water−Protein Fluctuations. J. Am. Chem. Soc 2009, 131 (30), 10677–10691. 10.1021/ja902918p. [DOI] [PubMed] [Google Scholar]
- (45).Bye JW; Meliga S; Ferachou D; Cinque G; Zeitler JA; Falconer RJ Analysis of the Hydration Water around Bovine Serum Albumin Using Terahertz Coherent Synchrotron Radiation. J. Phys. Chem. A 2014, 118 (1), 83–88. 10.1021/jp407410g. [DOI] [PubMed] [Google Scholar]
- (46).Heugen U; Schwaab G; Bründermann E; Heyden M; Yu X; Leitner DM; Havenith M Solute-Induced Retardation of Water Dynamics Probed Directly by Terahertz Spectroscopy. Proc. Natl. Acad. Sci 2006, 103 (33), 12301–12306. 10.1073/pnas.0604897103. [DOI] [PMC free article] [PubMed] [Google Scholar]
- (47).Orecchini A; Paciaroni A; De Francesco A; Petrillo C; Sacchetti F Collective Dynamics of Protein Hydration Water by Brillouin Neutron Spectroscopy. J. Am. Chem. Soc 2009, 131 (13), 4664–4669. 10.1021/ja807957p. [DOI] [PubMed] [Google Scholar]
- (48).Heyden M; Tobias DJ Spatial Dependence of Protein-Water Collective Hydrogen-Bond Dynamics. Phys. Rev. Lett 2013, 111 (21), 218101. 10.1103/PhysRevLett.111.218101. [DOI] [PubMed] [Google Scholar]
- (49).Heyden M Resolving Anisotropic Distributions of Correlated Vibrational Motion in Protein Hydration Water. J. Chem. Phys 2014, 141, 22D509. 10.1063/1.4896073. [DOI] [PubMed] [Google Scholar]
- (50).Li T; Hassanali AA; Singer SJ Origin of Slow Relaxation Following Photoexcitation of W7 in Myoglobin and the Dynamics of Its Hydration Layer. J. Phys. Chem. B 2008, 112 (50), 16121–16134. 10.1021/jp803042u. [DOI] [PMC free article] [PubMed] [Google Scholar]
- (51).Pattni V; Vasilevskaya T; Thiel W; Heyden M Distinct Protein Hydration Water Species Defined by Spatially Resolved Spectra of Intermolecular Vibrations. J. Phys. Chem. B 2017, 121 (31), 7431–7442. 10.1021/acs.jpcb.7b03966. [DOI] [PMC free article] [PubMed] [Google Scholar]
- (52).Larini L; Ottochian A; De Michele C; Leporini D Universal Scaling between Structural Relaxation and Vibrational Dynamics in Glass-Forming Liquids and Polymers. Nat. Phys 2008, 4 (1), 42–45. 10.1038/nphys788. [DOI] [Google Scholar]
- (53).Starr FW; Sastry S; Douglas JF; Glotzer SC What Do We Learn from the Local Geometry of Glass-Forming Liquids? Phys. Rev. Lett 2002, 89 (12), 125501. 10.1103/PhysRevLett.89.125501. [DOI] [PubMed] [Google Scholar]
- (54).Horstmann R; Vogel M Common Behaviors Associated with the Glass Transitions of Water-like Models. J. Chem. Phys 2017, 147 (3), 034505. 10.1063/1.4993445. [DOI] [PubMed] [Google Scholar]
- (55).Haddadian EJ; Zhang H; Freed KF; Douglas JF Comparative Study of the Collective Dynamics of Proteins and Inorganic Nanoparticles. Sci. Rep 2017, 7 (1), 41671. 10.1038/srep41671. [DOI] [PMC free article] [PubMed] [Google Scholar]
- (56).Zhu Y; Giuntoli A; Zhang W; Lin Z; Keten S; Starr FW; Douglas JF The Effect of Nanoparticle Softness on the Interfacial Dynamics of a Model Polymer Nanocomposite. J. Chem. Phys 2022, 157 (9), 094901. 10.1063/5.0101551. [DOI] [PubMed] [Google Scholar]
- (57).Zheng X; Guo Y; Douglas JF; Xia W Understanding the Role of Cross-Link Density in the Segmental Dynamics and Elastic Properties of Cross-Linked Thermosets. J. Chem. Phys 2022, 157 (6), 064901. 10.1063/5.0099322. [DOI] [PubMed] [Google Scholar]
- (58).Delgado JD; Schlenoff JB Static and Dynamic Solution Behavior of a Polyzwitterion Using a Hofmeister Salt Series. Macromolecules 2017, 50 (11), 4454–4464. 10.1021/acs.macromol.7b00525. [DOI] [Google Scholar]
- (59).Makarov VA; Andrews BK; Pettitt BM Residence Times of Water Molecules in the Hydration Sites of Myoglobin. Biophys. J 2000, 79 (6), 2966–2974. 10.1016/S0006-3495(00)76533-7. [DOI] [PMC free article] [PubMed] [Google Scholar]
- (60).Mondal S; Ghanta KP; Bandyopadhyay S Dynamic Heterogeneity at the Interface of an Intrinsically Disordered Peptide. J. Chem. Inf. Model 2022, 62 (8), 1942–1955. 10.1021/acs.jcim.2c00019. [DOI] [PubMed] [Google Scholar]
- (61).Loparo JJ; Roberts ST; Tokmakoff A Multidimensional Infrared Spectroscopy of Water. I. Vibrational Dynamics in Two-Dimensional IR Line Shapes. J. Chem. Phys 2006, 125 (19), 194521. 10.1063/1.2382895. [DOI] [PubMed] [Google Scholar]
- (62).Cowan ML; Bruner BD; Huse N; Dwyer JR; Chugh B; Nibbering ETJ; Elsaesser T; Miller RJ D. Ultrafast Memory Loss and Energy Redistribution in the Hydrogen Bond Network of Liquid H2O. Nature 2005, 434 (7030), 199–202. 10.1038/nature03383. [DOI] [PubMed] [Google Scholar]
- (63).Sinha SK; Bandyopadhyay S Local Heterogeneous Dynamics of Water around Lysozyme: A Computer Simulation Study. Phys Chem Chem Phys 2012, 14 (2), 899–913. 10.1039/C1CP22575H. [DOI] [PubMed] [Google Scholar]
- (64).Chanda J; Bandyopadhyay S Hydrogen Bond Lifetime Dynamics at the Interface of a Surfactant Monolayer. J. Phys. Chem. B 2006, 110, 23443–23449. 10.1021/jp065203+. [DOI] [PubMed] [Google Scholar]
- (65).Chanda J; Chakraborty S; Bandyopadhyay S Sensitivity of Hydrogen Bond Lifetime Dynamics to the Presence of Ethanol at the Interface of a Phospholipid Bilayer. J. Phys. Chem. B 2006, 110 (8), 3791–3797. 10.1021/jp054275i. [DOI] [PubMed] [Google Scholar]
- (66).Pal S; Maiti PK; Bagchi B Exploring DNA Groove Water Dynamics through Hydrogen Bond Lifetime and Orientational Relaxation. J Chem Phys 2006, 125, 234903. 10.1063/1.2403872. [DOI] [PubMed] [Google Scholar]
- (67).Klein C; Sallai J; Jones TJ; Iacovella CR; McCabe C; Cummings PT A Hierarchical, Component Based Approach to Screening Properties of Soft Matter. In Foundations of Molecular Modeling and Simulation; Snurr RQ, Adjiman CS, Kofke DA, Eds.; Molecular Modeling and Simulation; Springer; Singapore: Singapore, 2016; pp 79–92. 10.1007/978-981-10-1128-3_5. [DOI] [Google Scholar]
- (68).Klein C; Summers AZ; Thompson MW; Gilmer JB; McCabe C; Cummings PT; Sallai J; Iacovella CR Formalizing Atom-Typing and the Dissemination of Force Fields with Foyer. Comput. Mater. Sci 2019, 167, 215–227. 10.1016/j.commatsci.2019.05.026. [DOI] [Google Scholar]
- (69).Horn HW; Swope WC; Pitera JW; Madura JD; Dick TJ; Hura GL; Head-Gordon T Development of an Improved Four-Site Water Model for Biomolecular Simulations: TIP4P-Ew. J. Chem. Phys 2004, 120 (20), 9665–9678. 10.1063/1.1683075. [DOI] [PubMed] [Google Scholar]
- (70).Joung IS; Cheatham TE Molecular Dynamics Simulations of the Dynamic and Energetic Properties of Alkali and Halide Ions Using Water-Model-Specific Ion Parameters. J. Phys. Chem. B 2009, 113 (40), 13279–13290. 10.1021/jp902584c. [DOI] [PMC free article] [PubMed] [Google Scholar]
- (71).Abascal JLF; Vega C A General Purpose Model for the Condensed Phases of Water: TIP4P/2005. J. Chem. Phys 2005, 123 (23), 234505. 10.1063/1.2121687. [DOI] [PubMed] [Google Scholar]
- (72).Zeron IM; Abascal JLF; Vega C A Force Field of Li + , Na + , K + , Mg 2+ , Ca 2+ , Cl − , and SO42− in Aqueous Solution Based on the TIP4P/2005 Water Model and Scaled Charges for the Ions. J. Chem. Phys 2019, 151 (13), 134504. 10.1063/1.5121392. [DOI] [PubMed] [Google Scholar]
- (73).Jorgensen WL; Maxwell DS; Tirado-Rives J Development and Testing of the OPLS All-Atom Force Field on Conformational Energetics and Properties of Organic Liquids. J. Am. Chem. Soc 1996, 118 (45), 11225–11236. 10.1021/ja9621760. [DOI] [Google Scholar]
- (74).Jorgensen WL; Gao J Monte Carlo Simulations of the Hydration of Ammonium and Carboxylate Ions. J. Phys. Chem 1986, 90 (10), 2174–2182. 10.1021/j100401a037. [DOI] [Google Scholar]
- (75).Canongia Lopes JN; Pádua AAH; Shimizu K Molecular Force Field for Ionic Liquids IV: Trialkylimidazolium and Alkoxycarbonyl-Imidazolium Cations; Alkylsulfonate and Alkylsulfate Anions. J. Phys. Chem. B 2008, 112 (16), 5039–5046. 10.1021/jp800281e. [DOI] [PubMed] [Google Scholar]
- (76).in ‘t Veld PJ; Rutledge GC Temperature-Dependent Elasticity of a Semicrystalline Interphase Composed of Freely Rotating Chains. Macromolecules 2003, 36 (19), 7358–7365. 10.1021/ma0346658. [DOI] [Google Scholar]
- (77).Saravi SH; Panagiotopoulos AZ Activity Coefficients and Solubilities of NaCl in Water–Methanol Solutions from Molecular Dynamics Simulations. J. Phys. Chem. B 2022, 126 (15), 2891–2898. 10.1021/acs.jpcb.2c00813. [DOI] [PubMed] [Google Scholar]
- (78).Kashefolgheta S; Vila Verde A Developing Force Fields When Experimental Data Is Sparse: AMBER/GAFF-Compatible Parameters for Inorganic and Alkyl Oxoanions. Phys. Chem. Chem. Phys 2017, 19 (31), 20593–20607. 10.1039/C7CP02557B. [DOI] [PubMed] [Google Scholar]
- (79).Thompson AP; Aktulga HM; Berger R; Bolintineanu DS; Brown WM; Crozier PS; in ‘t Veld PJ; Kohlmeyer A; Moore SG; Nguyen TD; et al. LAMMPS - a Flexible Simulation Tool for Particle-Based Materials Modeling at the Atomic, Meso, and Continuum Scales. Comput. Phys. Commun 2022, 271, 108171. 10.1016/j.cpc.2021.108171. [DOI] [Google Scholar]
- (80).Hockney RW; Eastwood JW Computer Simulation Using Particles, 0 ed.; CRC Press, 2021. 10.1201/9780367806934. [DOI] [Google Scholar]
- (81).Maginn EJ; Messerly RA; Carlson DJ; Roe DR; Elliot JR Best Practices for Computing Transport Properties 1. Self-Diffusivity and Viscosity from Equilibrium Molecular Dynamics [Article v1.0]. Living J. Comput. Mol. Sci 2020, 2 (1). 10.33011/livecoms.1.1.6324. [DOI] [Google Scholar]
- (82).Basconi JE; Shirts MR Effects of Temperature Control Algorithms on Transport Properties and Kinetics in Molecular Dynamics Simulations. J. Chem. Theory Comput 2013, 9 (7), 2887–2899. 10.1021/ct400109a. [DOI] [PubMed] [Google Scholar]
- (83).De Marzio M; Camisasca G; Rovere M; Gallo P Mode Coupling Theory and Fragile to Strong Transition in Supercooled TIP4P/2005 Water. J. Chem. Phys 2016, 144 (7), 074503. 10.1063/1.4941946. [DOI] [PubMed] [Google Scholar]
- (84).Gowers R; Linke M; Barnoud J; Reddy T; Melo M; Seyler S; Domański J; Dotson D; Buchoux S; Kenney I; et al. MDAnalysis: A Python Package for the Rapid Analysis of Molecular Dynamics Simulations; Austin, Texas, 2016; pp 98–105. 10.25080/Majora-629e541a-00e. [DOI]
- (85).Michaud-Agrawal N; Denning EJ; Woolf TB; Beckstein O MDAnalysis: A Toolkit for the Analysis of Molecular Dynamics Simulations. J. Comput. Chem 2011, 32 (10), 2319–2327. 10.1002/jcc.21787. [DOI] [PMC free article] [PubMed] [Google Scholar]
- (86).Rapaport DC Hydrogen Bonds in Water: Network Organization and Lifetimes. Mol. Phys 1983, 50 (5), 1151–1162. 10.1080/00268978300102931. [DOI] [Google Scholar]
- (87).Stillinger FH Water Revisited. Science 1980, 209 (4455), 451–457. 10.1126/science.209.4455.451. [DOI] [PubMed] [Google Scholar]
- (88).Mary P; Bendejacq DD; Labeau M-P; Dupuis P Reconciling Low- and High-Salt Solution Behavior of Sulfobetaine Polyzwitterions. J. Phys. Chem. B 2007, 111 (27), 7767–7777. 10.1021/jp071995b. [DOI] [PubMed] [Google Scholar]
- (89).Chen L; Honma Y; Mizutani T; Liaw D-J; Gong JP; Osada Y Effects of Polyelectrolyte Complexation on the UCST of Zwitterionic Polymer. Polymer 2000, 41 (1), 141–147. 10.1016/S0032-3861(99)00161-5. [DOI] [Google Scholar]
- (90).Liaw D-J; Huang C-C Dilute Solution Properties of Poly(3-Dimethyl Acryloyloxyethyl Ammonium Propiolactone). Polymer 1997, 38 (26), 6355–6362. 10.1016/S0032-3861(97)00211-5. [DOI] [Google Scholar]
- (91).Schulz D; Peiffer D; Larabee A; Kaladas J; Soni L; Handwerker B; Garner R Phase Behaviour and Solution Properties of Sulphobetaine Polymers. Polymer 1986, 27 (11), 1734–1742. 10.1016/0032-3861(86)90269-7. [DOI] [Google Scholar]
- (92).Rinne KF; Schulz JCF; Netz RR Impact of Secondary Structure and Hydration Water on the Dielectric Spectrum of Poly-Alanine and Possible Relation to the Debate on Slaved versus Slaving Water. J. Chem. Phys 2015, 142 (21), 215104. 10.1063/1.4921777. [DOI] [PubMed] [Google Scholar]
- (93).Out DJP; Los JM Viscosity of Aqueous Solutions of Univalent Electrolytes from 5 to 95□C. J. Solut. Chem 1980, 9 (1), 19–35. 10.1007/BF00650134. [DOI] [Google Scholar]
- (94).Wang X; Tong X; Zhang H; Douglas JF String-like Collective Motion and Diffusion in the Interfacial Region of Ice. J. Chem. Phys 2017, 147 (19), 194508. 10.1063/1.5004177. [DOI] [PubMed] [Google Scholar]
- (95).Zhang H; Yang Y; Douglas JF Influence of String-like Cooperative Atomic Motion on Surface Diffusion in the (110) Interfacial Region of Crystalline Ni. J. Chem. Phys 2015, 142 (8), 084704. 10.1063/1.4908136. [DOI] [PMC free article] [PubMed] [Google Scholar]
- (96).Asthagiri D; Paulaitis M; Pratt L Thermodynamics of Hydration from the Perspective of the Molecular Quasichemical Theory of Solutions. J. Phys. Chem. B 2021, 125, 8294–8304. 10.1021/acs.jpcb.1c04182. [DOI] [PubMed] [Google Scholar]
- (97).Dudowicz J; Douglas JF; Freed KF Mixtures of Two Self- and Mutually-Associating Liquids: Phase Behavior, Second Virial Coefficients, and Entropy-Enthalpy Compensation in the Free Energy of Mixing. J. Chem. Phys 2017, 147 (6), 064909. 10.1063/1.4996921. [DOI] [PMC free article] [PubMed] [Google Scholar]
- (98).Vargas-Lara F; Starr FW; Douglas JF Molecular Rigidity and Enthalpy–Entropy Compensation in DNA Melting. Soft Matter 2017, 13 (44), 8309–8330. 10.1039/C7SM01220A. [DOI] [PubMed] [Google Scholar]
- (99).Kikuchi M; Terayama Y; Ishikawa T; Hoshino T; Kobayashi M; Ohta N; Jinnai H; Takahara A Salt Dependence of the Chain Stiffness and Excluded-Volume Strength for the Polymethacrylate-Type Sulfopropylbetaine in Aqueous NaCl Solutions. Macromolecules 2015, 48 (19), 7194–7204. 10.1021/acs.macromol.5b01116. [DOI] [Google Scholar]
- (100).Andreev M; Chremos A; de Pablo J; Douglas JF Coarse-Grained Model of the Dynamics of Electrolyte Solutions. J. Phys. Chem. B 2017, 121 (34), 8195–8202. 10.1021/acs.jpcb.7b04297. [DOI] [PubMed] [Google Scholar]
- (101).Robinson RA; Stokes RH Electrolyte Solutions, 2nd rev. ed.; Dover Publications: Mineola, NY, 2002. [Google Scholar]
- (102).Pike SJ; Lavagnini E; Varley LM; Cook JL; Hunter CA H-Bond Donor Parameters for Cations. Chem. Sci 2019, 10 (23), 5943–5951. 10.1039/C9SC00721K. [DOI] [PMC free article] [PubMed] [Google Scholar]
- (103).Bandyopadhyay S; Chakraborty S; Bagchi B Secondary Structure Sensitivity of Hydrogen Bond Lifetime Dynamics in the Protein Hydration Layer. J. Am. Chem. Soc 2005, 127, 16667. 10.1021/ja054462u. [DOI] [PubMed] [Google Scholar]
- (104).Guillaud E; Merabia S; de Ligny D; Joly L Decoupling of Viscosity and Relaxation Processes in Supercooled Water: A Molecular Dynamics Study with the TIP4P/2005f Model. Phys. Chem. Chem. Phys 2017, 19 (3), 2124–2130. 10.1039/C6CP07863J. [DOI] [PubMed] [Google Scholar]
- (105).Comez L; Paolantoni M; Sassi P; Corezzi S; Morresi A; Fioretto D Molecular Properties of Aqueous Solutions: A Focus on the Collective Dynamics of Hydration Water. Soft Matter 2016, 12 (25), 5501–5514. 10.1039/C5SM03119B. [DOI] [PubMed] [Google Scholar]
- (106).Heyda J; Dzubiella J Ion-Specific Counterion Condensation on Charged Peptides: Poisson–Boltzmann vs. Atomistic Simulations. Soft Matter 2012, 8 (36), 9338. 10.1039/c2sm25599e. [DOI] [Google Scholar]
Associated Data
This section collects any data citations, data availability statements, or supplementary materials included in this article.