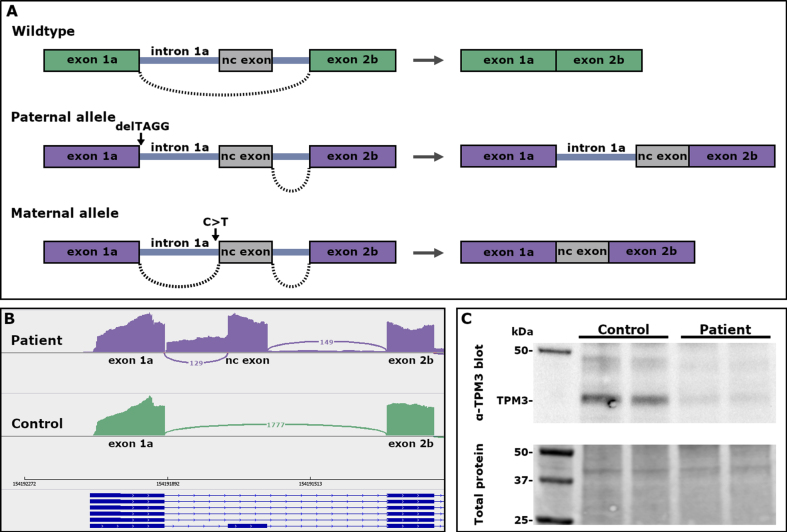
Fig. 2.
(A) A schematic representation of the effect of the TPM3 variants on pre-mRNA splicing. (B) Sashimi plots showing the splicing pattern in the 5’end of TPM3. Inclusion of intron 1a and a non-coding exon in transcripts from myotubes of the patient, and normal splicing of exon 1a to exon 2b in control myotubes. (C) Western blot showing low expression of TPM3 in myoblasts from the patient.

