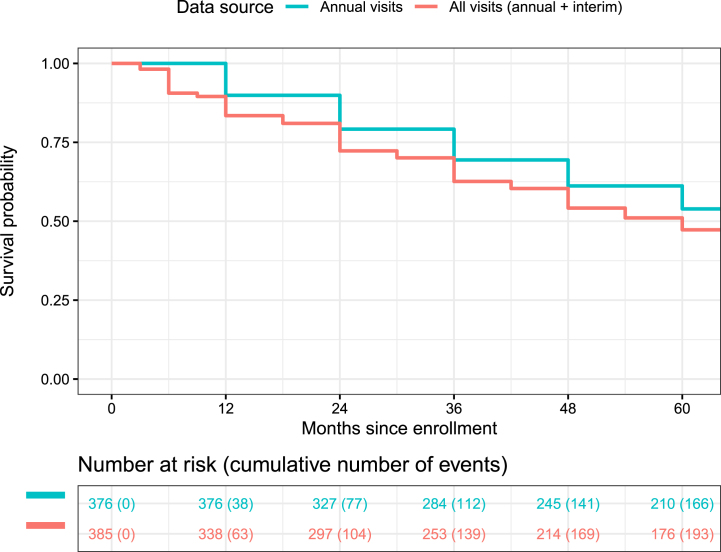
Fig. 1.
Kaplan-Meier curves of progression-free survival, as defined by reaching any progression milestone, based on data collected at 12, 24, 36, 48, and 60 months (blue) versus 3, 6, 9, 12, 18, 24, 30, 36, 42, 48, 54, and 60 months (red). Each curve reflects de novo PD participants who were milestone-free at baseline and completed at least one of the corresponding follow-up visits.

