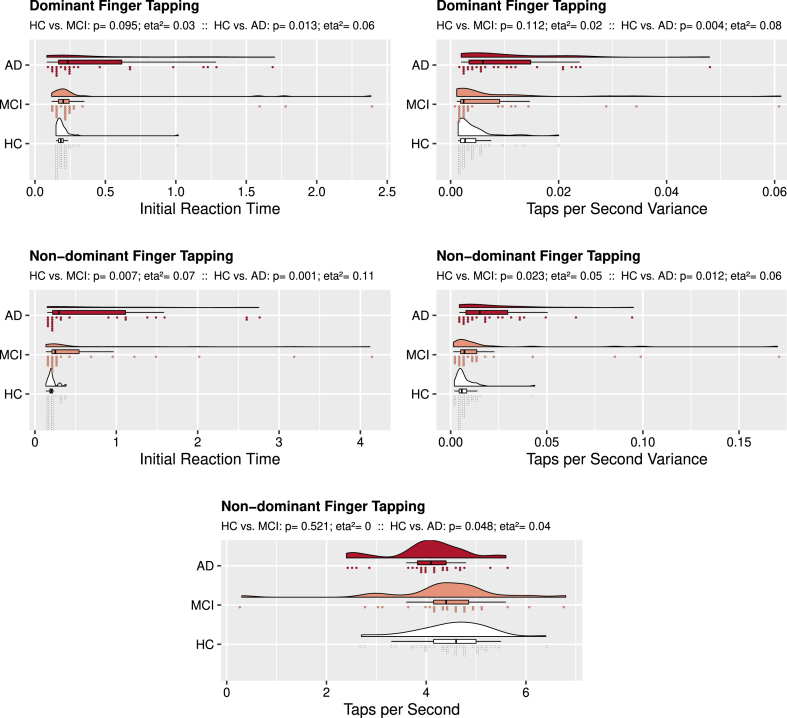
Fig. 1.
Unimanual Finger Tapping: Group Comparisons. Rain cloud plots with density curves, boxplots, and individual subject scores divided over 75 bins. The top cloud (red) presents data from the AD subject group, the middle cloud (salmon colored) presents data from the amnestic MCI subject group, the bottom cloud (white) presents data from the control group. Above each figure, p-values and eta2 as measure of effect size are reported 1) for the analysis comparing controls to amnestic MCI subjects (’HC vs. MCI’) and 2) for the analysis comparing controls to AD subjects (’HC vs. AD’). For dominant finger tapping AD performed worse than controls on Initial Reaction Time and Taps per Second Variance. For the non-dominant finger tapping, both AD and amnestic MCI performed worse on these measures, while AD also had fewer Taps per Second than controls.

