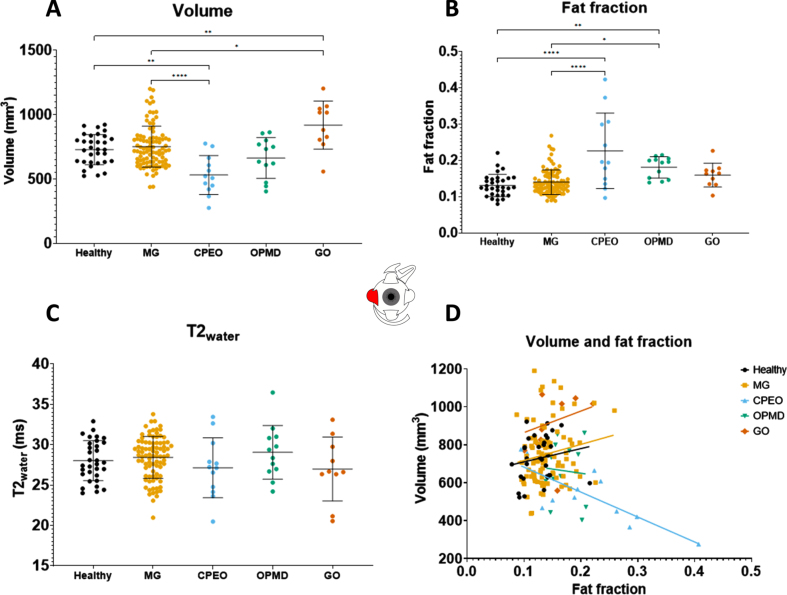
Fig. 2.
Volume values, fat fraction values, T2water values and the correlation between fat fraction and volume of the lateral rectus as measured with quantitative MRI for the different groups: healthy controls, myasthenia gravis (MG), chronic progressive external ophthalmoplegia (CPEO), oculopharyngeal muscular dystrophy (OPMD) and Graves’ orbitopathy. (GO). *is p≤ 0.05; **is p≤0.01; ***is p≤ 0.001; ****is p≤ 0.0001.

