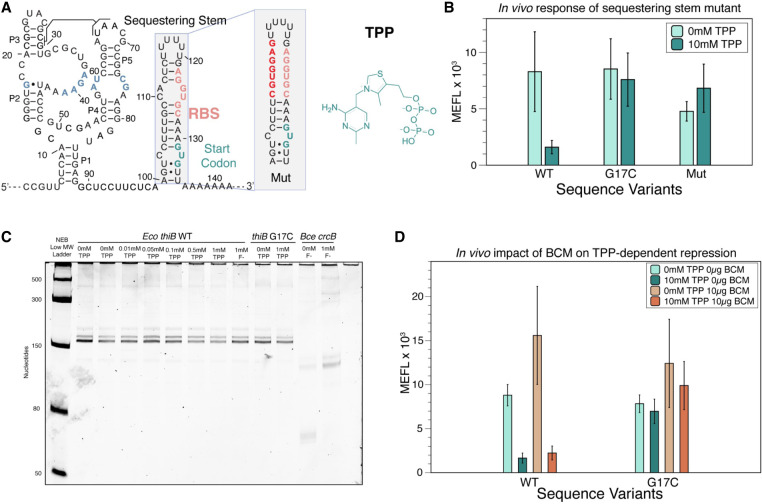
FIGURE 1.
The thiB E. coli TPP riboswitch represses translation through a sequestering stem that includes the RBS. (A) Proposed secondary structure of the ligand-bound E. coli thiB TPP riboswitch based on the published crystal structure (Serganov et al. 2006), Rfam sequence alignment (Kalvari et al. 2017), and the sequestering stem secondary structure modeled using RNAstructure (Reuter and Mathews 2010). Ligand-binding nucleotides within the ligand-binding pocket are colored blue. The RBS and the start codon for the naturally encoded downstream thiB gene are colored in salmon and teal, respectively. The chemical structure of TPP is drawn next to the RNA, and a known tertiary interaction between the P2 and P3 stems is highlighted. Inset shows secondary structure model of a mutant sequestering stem designed to weaken base-pairing with the RBS. Mutated nucleotides in red. Secondary structures determined by using RNAstructure version 6.4 (Reuter and Mathews 2010). (B) Wild-type (WT) and mutant thiB riboswitch-regulated super folder green fluorescent protein (sfGFP) expression in E. coli cells measured by flow cytometry. Units shown are molecules of equivalent fluorescein (MEFL) determined by flow cytometry. (C) Single-round in vitro E. coli RNA polymerase transcription assay measuring transcription products on a 10% urea poly-acrylamide gel. The Bce crcB F− riboswitch, used as a positive control, terminates in the absence of F− at an expected length of 82 nt, and antiterminates in the presence of F− at an expected length of 124 nt. The expected length of the full thiB transcription product is 173 nt. (D) WT and mutant thiB riboswitch-regulated sfGFP expression in E. coli cells in the presence and absence of the Rho-inhibitor bicyclomycin (BCM) measured by flow cytometry. Bar graphs in B and D represent mean values across three biological replicates, each performed in technical triplicate for nine total data points (n = 9). Error bars represent the standard deviation from the mean. Data in C are n = 2 representative gels (Supplemental Fig. S7).

