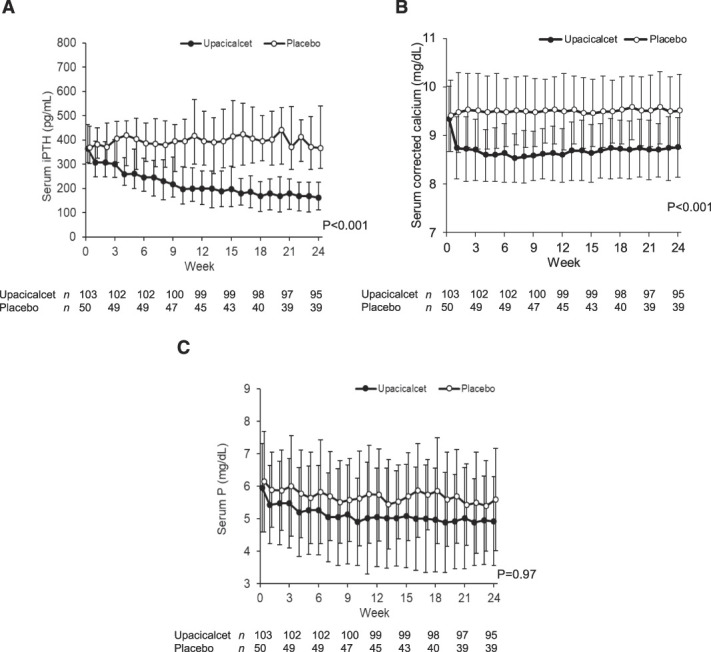
Figure 3.

Changes in serum iPTH, serum corrected calcium, and serum P concentrations. (A) Serum iPTH concentrations over time. (B)Serum corrected calcium concentrations over time. (C) Serum P concentrations over time. Data are shown as median with interquartile range (A) and mean±SD (B, C). Two-way analysis of variance was used for comparisons between groups.
