
Figure 1.
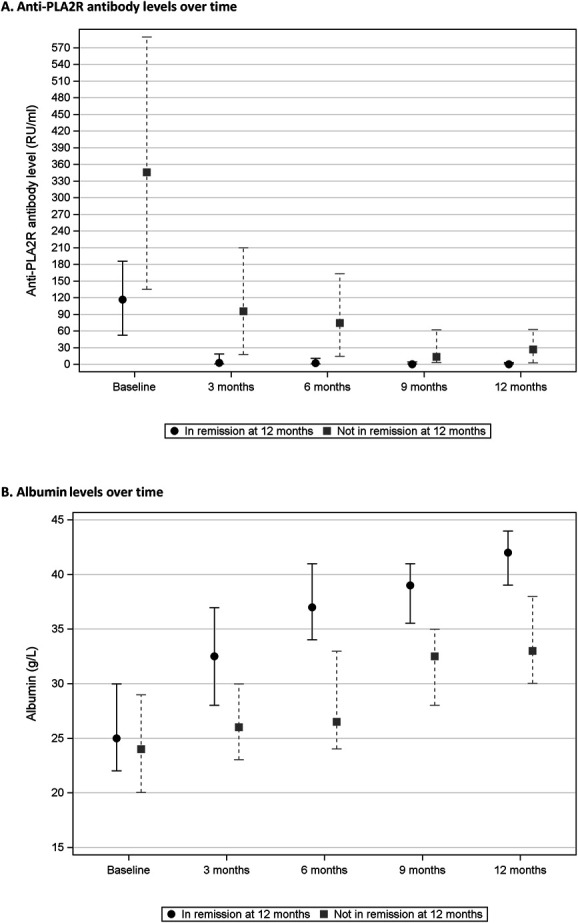
Anti-PLA2R antibody and albumin levels over time based on remission status at 12 months. Data in the figure are presented as median and interquartile range. (A) Anti-PLA2R antibody levels over time. (B) Albumin levels over time.
Official websites use .gov
A
.gov website belongs to an official
government organization in the United States.
Secure .gov websites use HTTPS
A lock (
) or https:// means you've safely
connected to the .gov website. Share sensitive
information only on official, secure websites.
Anti-PLA2R antibody and albumin levels over time based on remission status at 12 months. Data in the figure are presented as median and interquartile range. (A) Anti-PLA2R antibody levels over time. (B) Albumin levels over time.