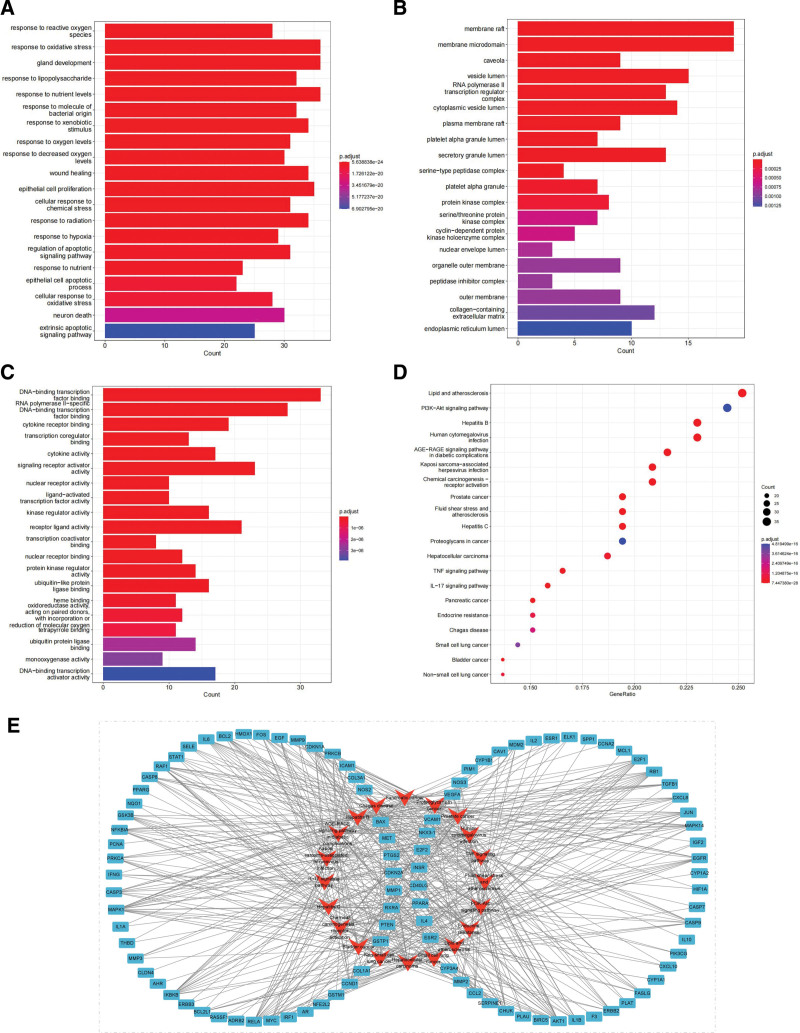
Figure 4.
GO enrichment and KEGG pathway analyses. Bar plots show (A) biological processes, (B) cell components, and (C) molecular functions of GO enrichment analysis. (D) Bubble plot shows KEGG pathway enrichment analysis. (E) Target-pathway network diagram of Ecliptae Herba in the treatment of breast cancer. GO = Gene ontology, KEGG = Kyoto encyclopedia of genes and genomes.

