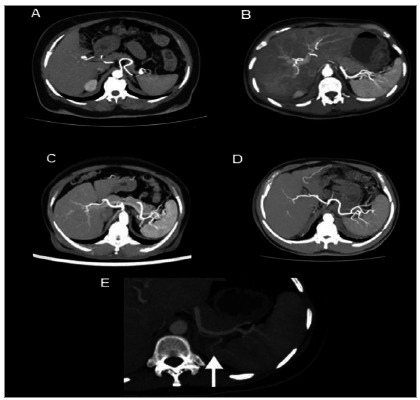
Figure 3. Maximum Intensity Projection (MIP) reconstructions in the axial computed tomography plane demonstrating (A) two terminal branches, (B) three terminal branches, (C) four terminal branches, (D) five terminal branches, and (E) polar artery (white arrow).

