Figure 3.

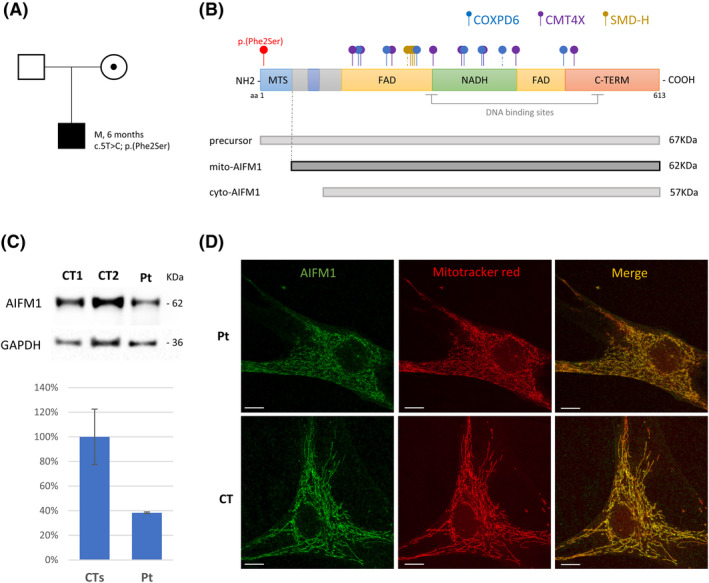
(A) Family pedigree and segregation analysis for the AIFM1 c.5T>C variant. (B) Scheme of AIFM1 protein with its main domains and AIFM1 isoforms (precursor AIFM1, mitochondrial and cytosolic isoform) with their predicted molecular weights. Dot‐end arrows indicate the position of the novel p.Phe2Ser variant (in red) and of published AIFM1 variants (with colors according to the corresponding phenotype). Dashed line were used for intronic variant affecting splicing junctions. (C) Immunoblot analysis of fibroblasts from patient (Pt) and controls (CT1, CT2) using antibodies against AIFM1 and GAPDH, the latter used as loading control. The graph reports percentages of the values of AIFM1/GAPDH signals obtained by densitometric analysis. One hundred per cent corresponds to the mean value from controls. (D) Representative images of immunofluorescence staining obtained with the anti‐AIFM1 antibody (green) and the mitochondrial marker Mitotracker (red) in fibroblasts from the patient (Pt) and a control (CT). The merged signals are reported in the right‐hand panels. Scale bar: 10 μm.
