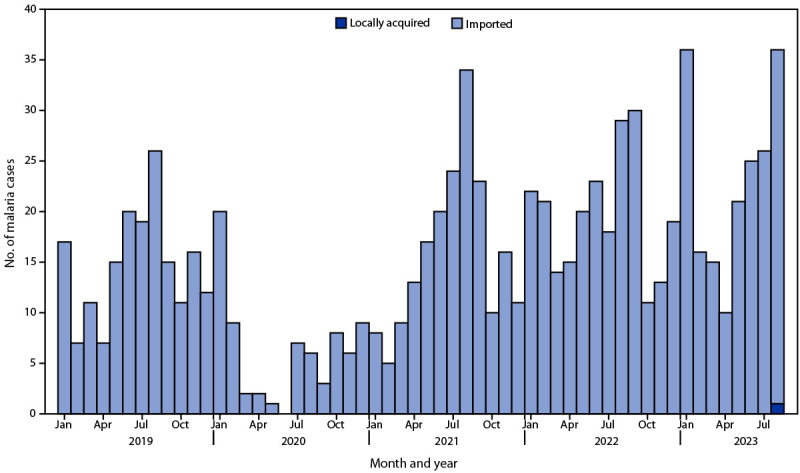
FIGURE.

Malaria cases, by month and year* — Maryland, January 1, 2019–August 31, 2023†,§
* Based on symptom onset date or diagnosis date, if onset date is unknown.
† Data from 2023 are preliminary.
§ Cases of imported malaria are influenced by travel, and high numbers of cases occur during July–September and in January. The COVID-19 pandemic affected the numbers of cases imported into the United States.
