Figure 5.
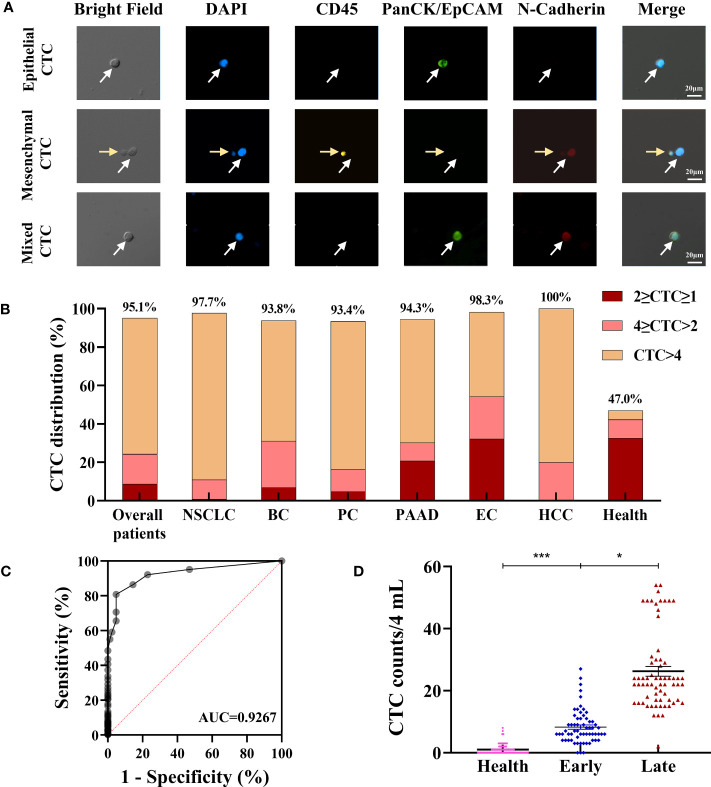
Evaluation of clinical utility of the CTC enrichment and characterization. (A) Phenotype feature of isolated CTCs: epithelial CTCs were defined as DAPI+/CD45-/PanCK+/N-Cadherin-; mesenchymal CTCs were defined as DAPI+/CD45-/PanCK-/N-Cadherin+; mixed type CTCs were defined as DAPI+/CD45-/PanCK+/N-Cadherin+. The white arrows indicate the CTCs, the yellow arrows indicate the WBCs. (B) CTC detection in cancer patients and healthy subjects. (C) ROC curve analysis of CTC counts in differentiating cancer patients from healthy subjects. (D) Difference of total CTC number in healthy subjects (n=83), early (n=62) and late (n=66) stage of NSCLC patients. Data are presented as the median with interquartile range; NS: not significant, *p < 0.05, **p < 0.01, ***p < 0.001 by two-tailed Student t-test; ROC: receive operating characteristic curve; AUC: area under the curve. Abbreviation: NSCLC, non-small cell lung cancer; BC, Breast cancer; PC, prostate cancer; PAAD, pancreatic adenocarcinoma; EC, esophageal cancer; HCC, Hepatocellular cancer.

