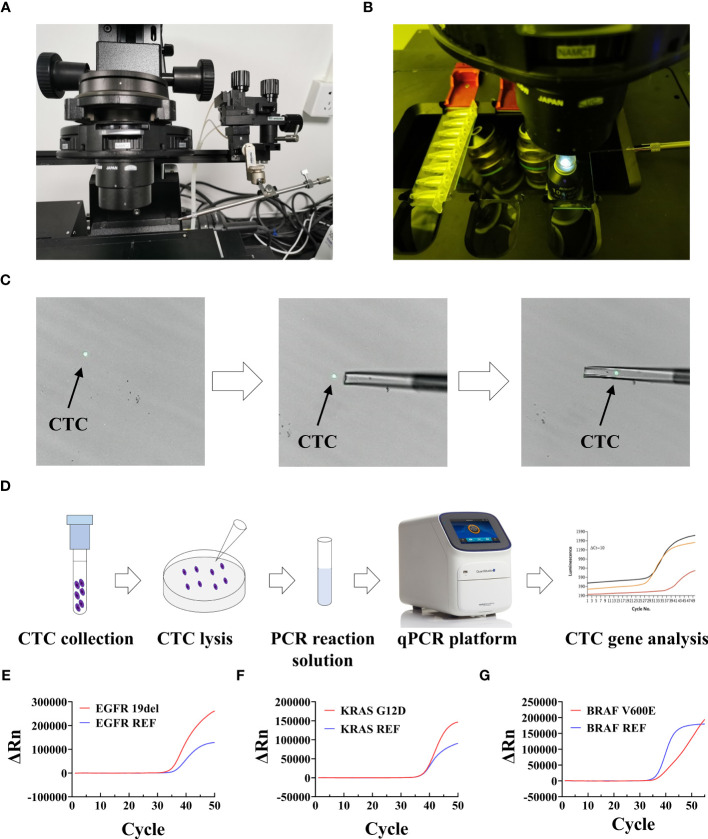
Figure 7.
Setup and workflow of CTC picking and gene mutation analysis. (A, B) Setup of the single-cell picking system. (C) An illustration of the CTC picking process. (D) Workflow of fluorescence PCR for CTC genetic test. (E–G) Representative qPCR curves of analyzed mutations in collected CTCs. ΔRn is the magnitude of the normalized fluorescence signal generated by the reporter at each cycle during the PCR amplification.

