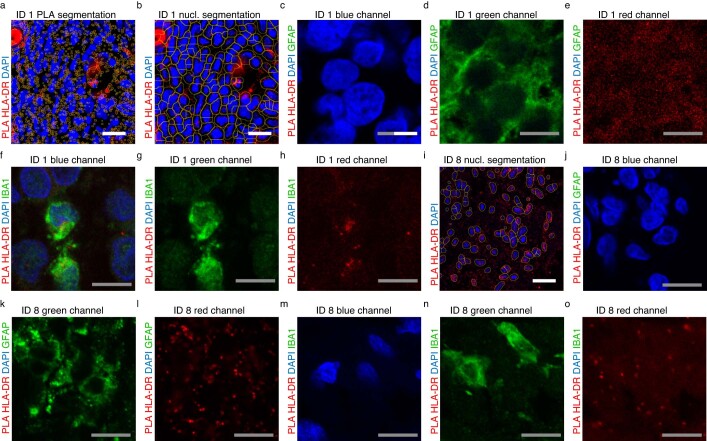
Extended Data Fig. 5. PLA segmentation and single channels of PLA images of patient ID 1 and ID 8.
a,b,i, Automated segmentation of PLA spots (a) and nuclei (b, i) of ID 1 and ID 8 following rolling ball background subtraction, filtering with gaussian blur and maxima detection. Scale bar in white = 30 μm. c-h, j-o, Single channels of PLA with co-stainings as indicated on the left for ID 1 and ID 8 from images in Fig. 4a–c. Scale bar in gray = 10 μm.). All PLAs were repeated independently two times with similar results.

