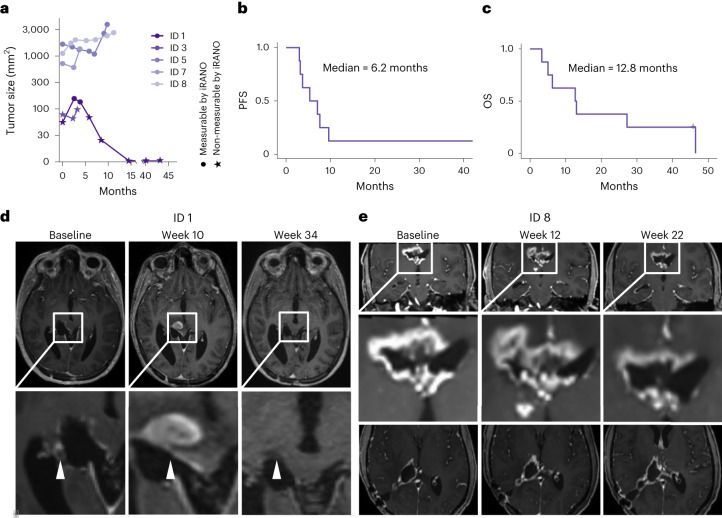
Fig. 3. Clinical response to H3K27M-vac.
a, Tumor size in mm2 as a function of time in months from start of vaccination. Size determined by product of maximal orthogonal diameters on T1-weighted contrast-enhanced MRI imaging. Dots indicate measurements that are considered measurable by iRANO criteria (cerebral lesion with diameter >10 mm). b,c, PFS (b) and OS (c) since the start of vaccination. d, T1-weighted with contrast enhancement (CE) MRI sequences of PsPD of patient ID 1 at baseline, week 10 and week 34. White arrows indicate tumor lesion with PsPD at week 10. e, T1-weighted with CE MRI series of patient ID 8 with early progression between baseline and week 12 followed by disease stabilization concurrent to first detectable H3K27M-specific immune response in peripheral blood in week 18.

