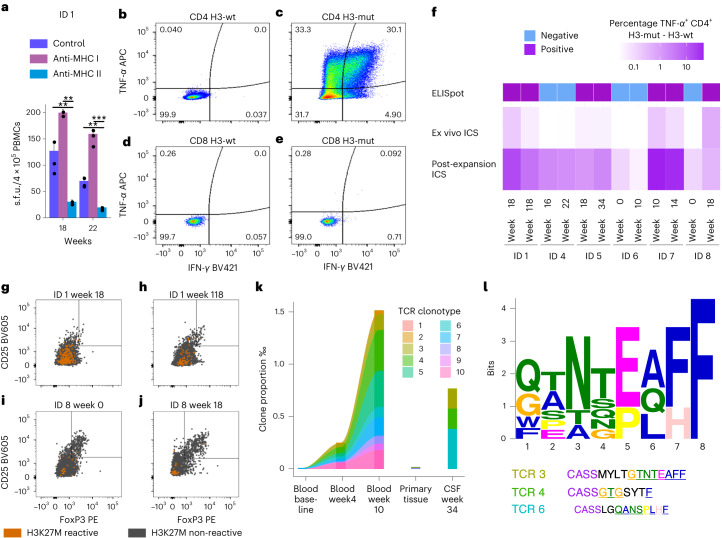
Fig. 5. H3K27M-specific immune responses are CD4+ T cell-mediated.
a, Suppression of H3K27M-specific IFN-γ-ELISpot response by anti-MHC class II antibody (anti-MHC II) (n = 2 biologically independent experiments (BIEs)), but not by anti-MHC class I antibody (anti-MHC I) (n = 3 BIE) compared to baseline (n = 3 BIE) 18 (P = 0.002; P = 0.008, top to bottom) and 22 (P = 0.001; P = 0.006, from top to bottom) weeks since start of H3K27M-vac treatment in patient ID 1. Two-sided t-test, not adjusted for multiple comparisons. Dots mark individual data points, bar plots show the mean and error bars indicate the s.d. ** signifies P < 0.01, *** signifies P < 0.001. b–e, Flow cytometry-based intracellular IFN-γ and tumor necrosis factor (TNF)-α detection in H3K27M-peptide expanded PBMCs restimulated with H3-wt (b,d) or H3-mut (c,e), gated on CD4+ (b,c) and CD8+ (d,e) T cell subsets. f, Difference in percentage of TNF-α-expressing cells among all CD4+ T cells between T cells stimulated with H3-mut and H3-wt either directly (ex vivo intracellular cytokine staining (ICS)) or following expansion of T cells with H3K27M peptide (post-expansion ICS). Samples were analyzed from ID 1, ID 4, ID 5, ID 6, ID 7 and ID 8 at the weeks indicated. ELISpot responses in the first column are displayed as in Fig. 1d. g–j, H3K27M-reactive, TNF-α+ CD4+ T cells (orange) among all CD4+ T cells (gray) did not comprise CD25+FoxP3+ regulatory T cells. Depicted are ex vivo ICS data from patient ID 1 week 18 (g) and week 118 (h) as well as patient ID 8 week 0 (i) and week 18 (j). k, Clonotype proportion of the ten most abundant H3K27M-vac expanded CD4+ T cells among all sequenced T cells in primary tissue, CSF and peripheral blood across different time points of patient ID 1. l, Motif plot of sequence similarities of the CDR3β region of top ten TCRs in k after removal of recurring CAS sequence in all ten TCRs. Overlap of CDR3β of TCR3, TCR4 and TCR6 detected in CSF with motif is indicated by color and underline.

