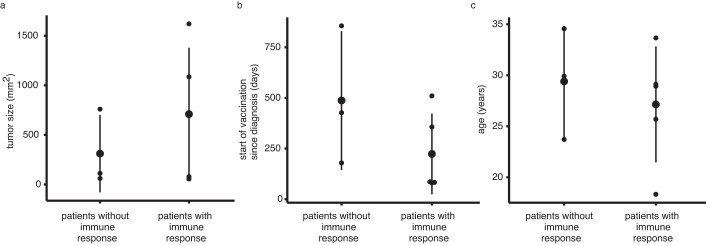
Extended Data Fig. 2. Distribution of tumor size, beginning of vaccination and age between patients with immune response and patients without response at baseline.
Distribution of tumor size in mm2 determined by product of maximal orthogonal diameters on T1 weighted contrast enhanced MRI imaging (a) time between histological diagnosis and start of vaccination in days (b) and patient age in years at start of vaccination (c) between patients with H3K27M specific immune response and patients without H3K27M specific immune response.

