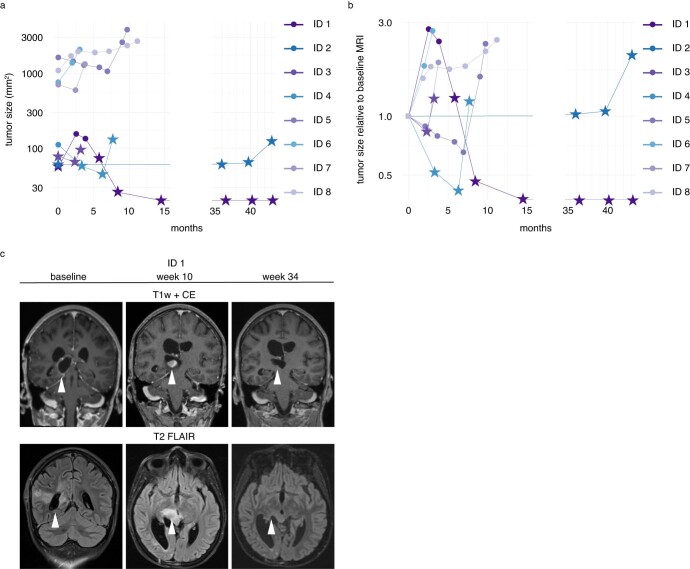
Extended Data Fig. 3. Longitudinal course of all tumor diameters and pseudoprogression in ID 1.
a, b Tumor size in mm2 (a) and relative to baseline before start of vaccination (b) as a function of time in months from start of vaccination. Size determined by product of maximal orthogonal diameters on T1 weighted contrast enhanced (CE) MRI imaging. Dots indicate measurements that are considered measurable by iRANO criteria (that is cerebral lesion with diameters > 10 mm) and stars non-measurable lesions by iRANO criteria. c, Coronary T1-weighted CE sequences (top) and fluid-attenuated inversion recovery sequences (bottom) of PsPD of patient ID 1 at baseline, week 10 and week 34. White arrows indicate tumor lesion with PsPD in week 10.

