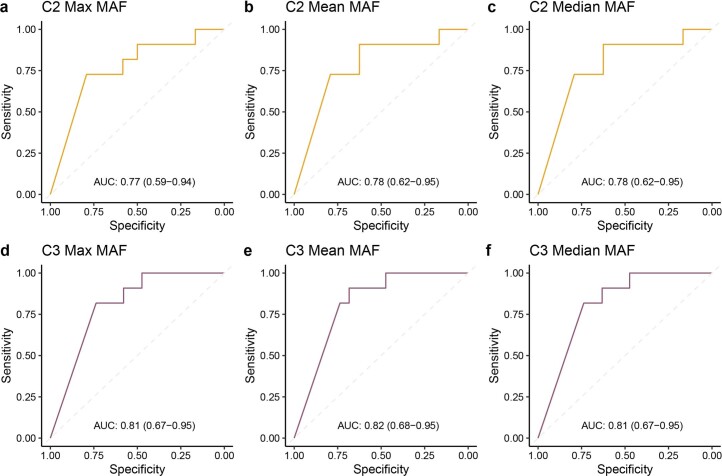
Extended Data Fig. 6. ROC curves for ctDNA change from C1 to C2 and C1 to C3 and RECIST response.
MAF dynamics, computed from C1D1 to each on-therapy time point, were used to predict the radiographic response at 12 weeks by analyzing the maximum (a, d), mean (b,e), and median (c, f) MAF across all observed tumor-derived mutations. At each on-therapy time point, the change in MAF measure (maximum, mean, or median) compared to the baseline sample was calculated, and receiver operating characteristic (ROC) curves were drawn to assess performance. These analyses supported a slightly higher analytical performance of ctDNA molecular response at C3D1, with no significant differences noted when maximal, mean or median mutant allele frequencies of tumor-derived mutations were used to measure circulating tumor burden. Area under the curve along with 95% confidence intervals are reported.

