
Extended Data Fig. 7. Baseline levels of circulating tumor burden differences based on radiographic RECIST response.
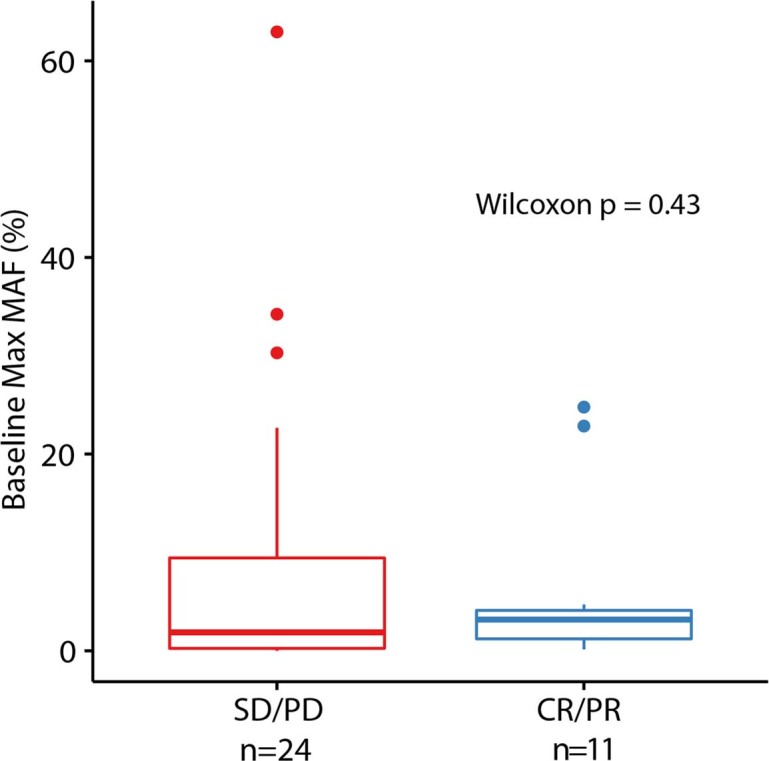
There were no differences in MaxMAF values between patients with radiographic SD/PD (n = 24, non-responder group) compared to patients with radiographic CR/PR (n = 11, responder group) as assessed by the Wilcoxon test (two sided p = 0.43). Box plots depict the median value and hinges correspond to the first and third quartiles. The whiskers extend from the corresponding hinge to the furthest value within 1.5 * the interquartile range from the hinge.