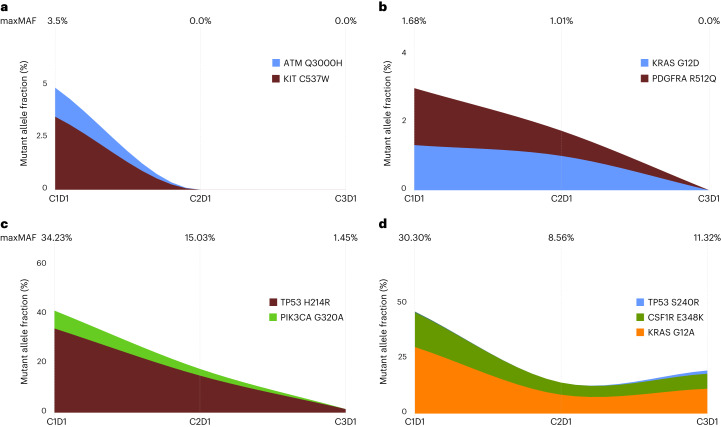
Fig. 4. Representative ctDNA kinetics patterns.
a–d, We identified four patterns of ctDNA kinetics: 13 patients showed ctDNA maxMAF clearance at C2D1, as shown here for patient BR360006 (a); two patients showed ctDNA maxMAF clearance at C3D1, as shown here for patient BR360015 (b); two patients had ctDNA reduction >85% but <100%, as shown here for patient BR360010 (c); and 18 patients showed ctDNA persistence throughout the timepoints analyzed, as shown here for patient BR360004 (d). Timepoints (C1D1, C2D1 and C3D1) are shown at the top of each panel, alongside the maxMAF of tumor-derived variants detected at each timepoint. Stacked area plots represent MAFs of individual tumor-specific variants as measured in liquid biopsies at baseline and on-therapy timepoints. Of note, the plot does not reflect the unknown hierarchical structure of tumor subclones harboring mutations, and, as such, the height of the area plot indicates the sum of MAFs from all mutations at each timepoint.

