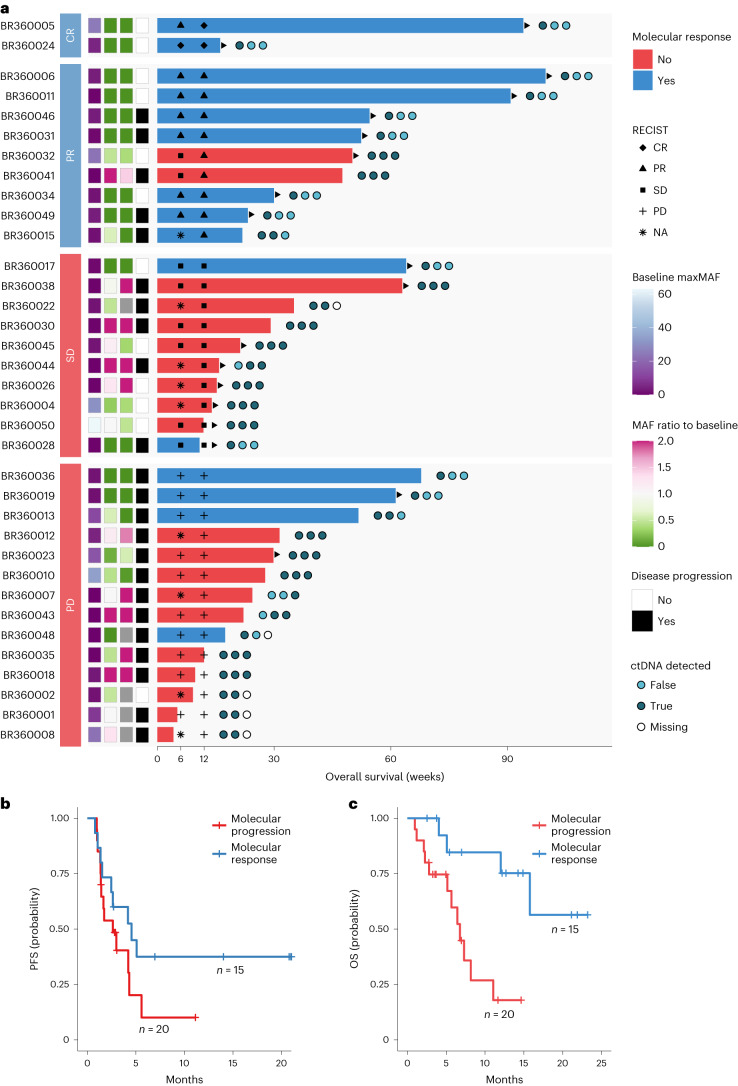
Fig. 5. Analyses of PFS and OS by ctDNA molecular response.
a, Swimmer plot depicting the timing of radiographic response assessment, molecular response trajectory and OS for each evaluable patient in the BR.36 stage 1 cohort. The patients are grouped by radiographic response category and ordered by OS within each group, where the bar color indicates the assigned molecular response. The circles to the right of each bar depict detection of ctDNA in the three liquid biopsy samples analyzed from timepoints C1D1, C2D1 and C3D1, from left to right, respectively. The three annotation columns to the left of the bars indicate the value of maxMAF in the baseline sample and the ratio of maxMAF in the C2 and C3 timepoints compared to the baseline. Gray tiles mark timepoints with no sample available for analysis. Triangles at the edge of survival intervals indicate ongoing follow-up. b,c, Patients with ctDNA mR had a longer PFS and OS compared to patients with mPD (5.03 months versus 2.6 months and not reached versus 7.23 months for PFS and OS, respectively; HR = 0.55, 95% CI: 0.27–1.13 and HR = 0.16, 95% CI: 0.05–0.50 for PFS and OS, respectively). NA, not applicable.

