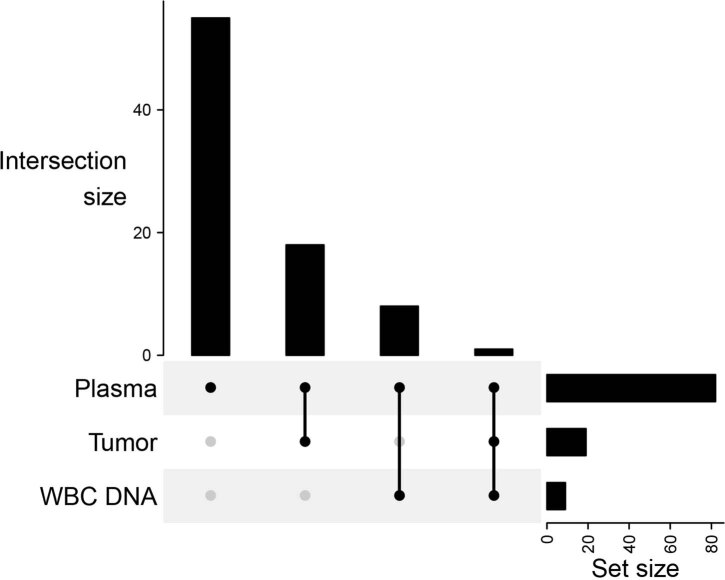
Extended Data Fig. 2. Intersection of variants detected by plasma, WBC DNA and tumor next-generation sequencing for the BR.36 study participants.
UpSet plot for all plasma mutations detected (n = 82). From left to right the vertical bars represent the number of mutations that were detected only in the plasma (n = 55), detected in plasma and matched tumor (n = 18), detected in plasma and matched WBC DNA NGS (n = 8) and reported in plasma, tumor and matched WBC DNA NGS (n = 1). The horizontal bars on the right represent the total number of plasma mutations (n = 82), total plasma mutations in the tumor (n = 19) and total plasma mutations detected in the WBC DNA samples (n = 9).

