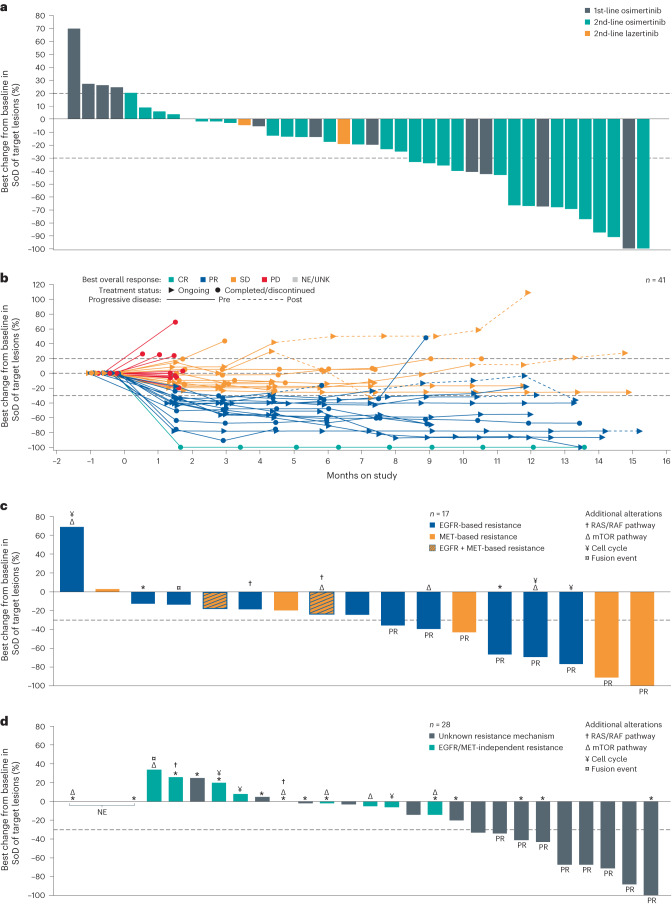
Fig. 2. Anti-tumor activity of amivantamab + lazertinib combination in part 2 expansion cohort E: osimertinib-relapsed NSCLC with common EGFR mutations (panels a and b) and among patients with and without identified EGFR-based and/or MET-based resistance (panels c and d).
a, Waterfall plot displaying best percent change from baseline in sum of lesion diameters among patients enrolled in the osimertinib-relapsed cohort by receipt of osimertinib/lazertinib as first-line (yellow) or second-line (blue/green) therapy. Teal bars denote patients who received the third-generation EGFR TKI lazertinib instead of osimertinib. Four patients did not have any post-baseline disease assessments and are not included in the plot. b, Spider plot displaying percent change from baseline in sum of diameters of target lesions over time in patients enrolled in the osimertinib-relapsed cohort. Best response of CR (green), PR (blue), SD (orange) and PD (red) are indicated. Gray lines represent patients who were not evaluable (NE). Four patients did not have any post-baseline disease assessments and are not included in the plot. c, Waterfall plot displaying best percent change from baseline in sum of diameters of target lesions among 17 patients with identified EGFR-based and MET-based osimertinib resistance mechanisms. d, Waterfall plot displaying best percent change from baseline in sum of diameters of target lesions among 28 patients with unknown or EGFR-independent and MET-independent osimertinib resistance mechanisms identified by NGS. Additional alterations identified in each patient are indicated by the symbols. Asterisks denote patients who did not have tumor NGS. SoD, sum of diameters; UNK, unknown.

