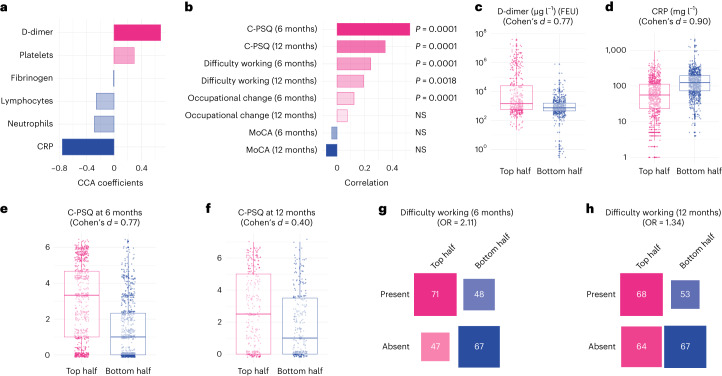
Fig. 3. High D-dimer is linked with subjective but not objective cognitive deficits.
a,b, A second dimension of covariation links high D-dimer with relatively low CRP to higher C-PSQ at 6 and 12 months (signs of subjective cognitive deficits) and signs of occupational impact (in terms of affected ability to work at 6 and 12 months and occupational changes at 6 months) but little difference in MoCA. P values are derived from permutation tests, two-sided and not corrected for multiple comparisons. c–h, Distribution of different variables between the top half and the bottom half of the cohort along this second dimension (n = 977, 1,777, 1,502, 584, 233 and 252 individual participants, respectively). The center of the boxes represents the median, their bounds represent the 25th and 75th centile and the lower and upper ends of whiskers represent the smallest/largest value, no further than 1.5 × IQR from the box-plot respective end. Distribution of all variables investigated can be found in Supplementary Figs. 8–10. NS, P > 0.05.

