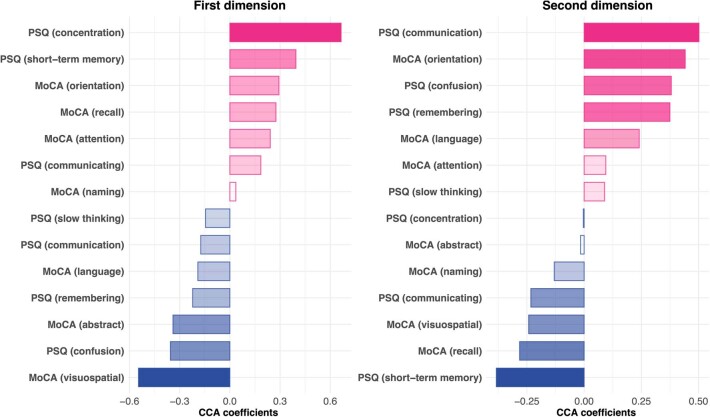
Extended Data Fig. 1. Contributions of each cognitive item to the dimensions of covariation.
These report the weights of each item in the weighted combinations that represent the cognitive profile for each dimension. Note that positive weights (for MoCA items) and negative weights (for C-PSQ items) do not necessarily imply that individuals who scored high on the dimension of covariation had better cognitive outcomes for those items since these items might covary with other items with opposite weights. See Supplementary Figs. 5–6, 9 and 10 for distribution of individual items along dimensions of covariation.

