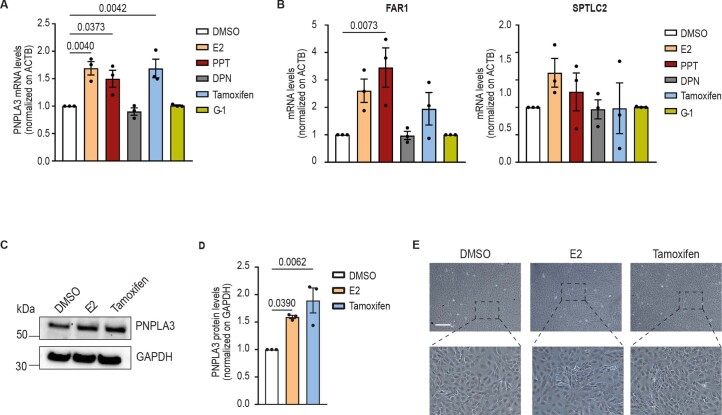
Extended Data Fig. 6. Impact of ERα agonists on PNPLA3 expression, intracellular lipids and lipotoxicity in HepaRG human hepatocytes.
A) qRT-PCR analysis of PNPLA3 mRNA level in human HepaRG cell line treated for 24 h with E2 (1 μM), PPT (1 μM), DPN (1 μM), tamoxifen (10 μM), G-1 (1 μM) and DMSO as negative control. B) qRT-PCR analysis of FAR1 and SPTLC2 mRNA level in human HepaRG cell line treated for 24 h with E2 (1 μM), PPT (1 μM), DPN (1 μM), tamoxifen (10 μM), G-1 (1 μM) and DMSO as negative control. C) Western blot analysis of PNPLA3 protein levels in HepG2 cells treated with E2 or tamoxifen and DMSO as negative control and D) relative quantification. E) Representative images of Oil Red O (ORO) staining for visualization of intracellular neutral lipids of HepaRG treated for 48 h with E2 (1 μM), tamoxifen (10 μM) and DMSO as negative control. Scale bar, 200 μM. Data in panel A, B and D are presented as mean ± SEM (n = 3 independent experiments); one-way ANOVA followed by Bonferroni’s post hoc test.

