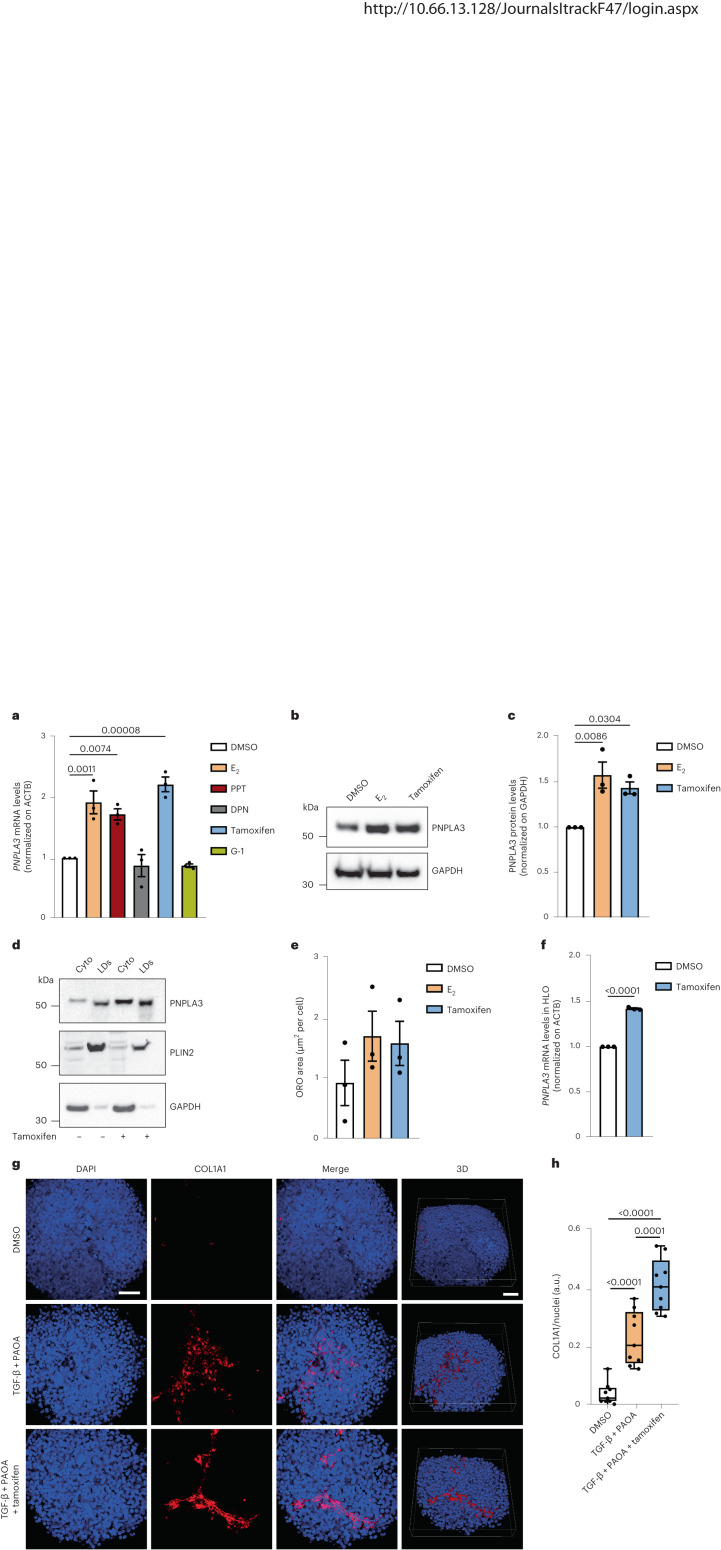
Fig. 3. Effect of estrogen-induced PNPLA3 expression on lipid droplet accumulation in human hepatocytes.
a, RT-qPCR analysis of PNPLA3 mRNA level in the human HepG2 cell line treated for 48 h with E2 (1 μM), PPT (1 μM), DPN (1 μM), tamoxifen (10 μM), G-1 (1 μM) and dimethyl sulfoxide (DMSO) as a negative control. b,c, Western blot analysis of PNPLA3 protein levels in HepG2 cells treated with E2 or tamoxifen and DMSO as a negative control (glyceraldehyde 3-phosphate dehydrogenase (GAPDH) used as loading control run on a different gel) (b) and relative quantification (c). d, Western blot analysis of PNPLA3, PLIN2 and GAPDH proteins in cytosolic and lipid droplet fractions obtained from cells treated for 48 h with fatty acids (oleic and palmitic acids, both at 250 μM) and tamoxifen or DMSO as a negative control. e, RT-qPCR analysis of PNPLA3 mRNA level in HLOs treated for 48 h with tamoxifen (10 μM) and DMSO as a negative control. f, Relative quantification of ORO staining for visualization of intracellular neutral lipids of HepG2 treated for 48 h with E2 (1 μM), tamoxifen (10 μM) and DMSO as a negative control. g, Immunofluorescence staining of DAPI (blue) and COL1A1 (red) of 3D spheroids (HepG2:LX-2, 24:1) treated for 48 h with a mix of palmitic and oleic acids (PAOA, 250 μM each), TGF-β (10 ng ml−1) and tamoxifen (10 μM) or DMSO as a negative control. Scale bar, 50 μm. h, Quantification of COL1A1 levels by ImageJ normalized to DAPI quantification. a.u., arbitrary units. Whiskers show minimum to maximum values, box bounds the 25th to 75th percentiles and the center the median value. Data in a, c and e are presented as mean ± s.e.m. (n = 3 independent experiments). One-way ANOVA followed by Bonferroni’s post hoc test were used. Data in f are represented as mean ± s.e.m. (n = 3 independent experiments). A two-sided, unpaired Student’s t-test was used. Data in h are mean ± s.e.m. (n = 9 from 3 independent experiments). A one-way ANOVA was followed by Bonferroni’s post hoc test.

