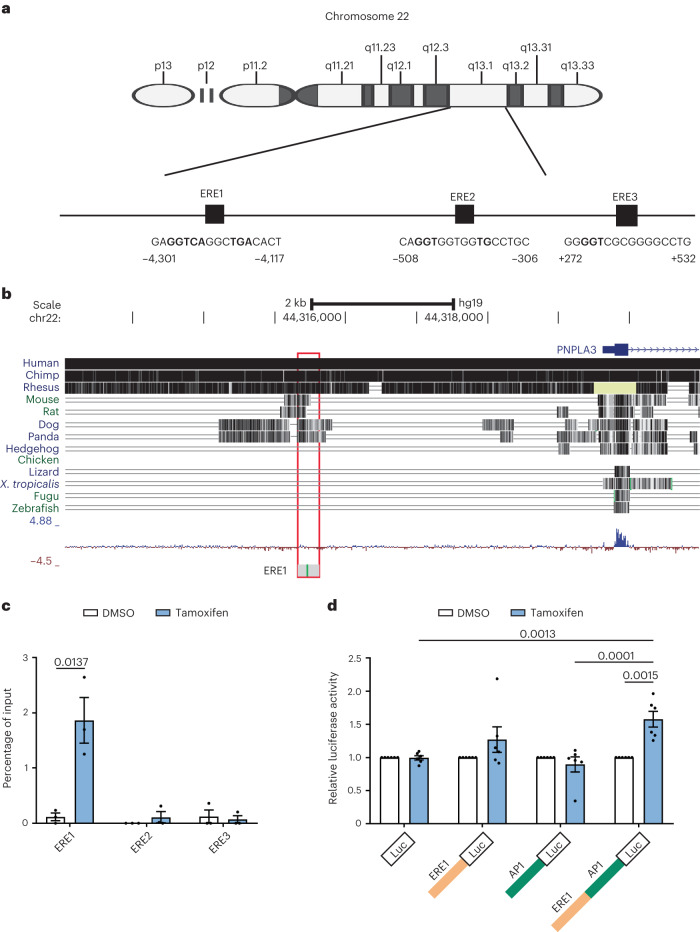
Fig. 4. Prediction and identification of ER-α-binding sites at the promoter region of the PNPLA3 gene.
a, Representation of EREs located at the TSS and promoter region of the PNPLA3 gene. The coordinates are based on the GRCh37/hg19 build (National Center for Biotechnology Information (NCBI) reference sequence NC_000022.10). b, PNPLA3-ERE1 showing a high degree of conservation across other mammal genomes. The coordinates are based on the GRCh37/hg19 build (NCBI reference sequence NC_000022.10). c, ChIP in HepG2 treated for 24 h with tamoxifen (10 μM) or DMSO as a negative control. The levels of ER-α at the ERE1, ERE2 and ERE3 of the PNPLA3 gene were measured by RT-qPCR. Data are presented as mean ± s.e.m. (n = 3 independent experiments). The unpaired Student’s t-test was used. d, Luciferase (Luc) reporter activity analysis measuring the impact of tamoxifen on the transcriptional regulation of the PNPLA3 putative enhancer region. The sequence containing both ERE1 and AP-1 sequences or ERE1 and AP-1 alone was cloned above the luciferase construct. Data in c are mean ± s.e.m. (n = 3 independent experiments). A two-sided, unpaired Student’s t-test was used. Data in d are mean ± s.e.m. (n = 6 independent experiments). A two-way ANOVA was used followed by Bonferroni’s multiple-comparison test.

