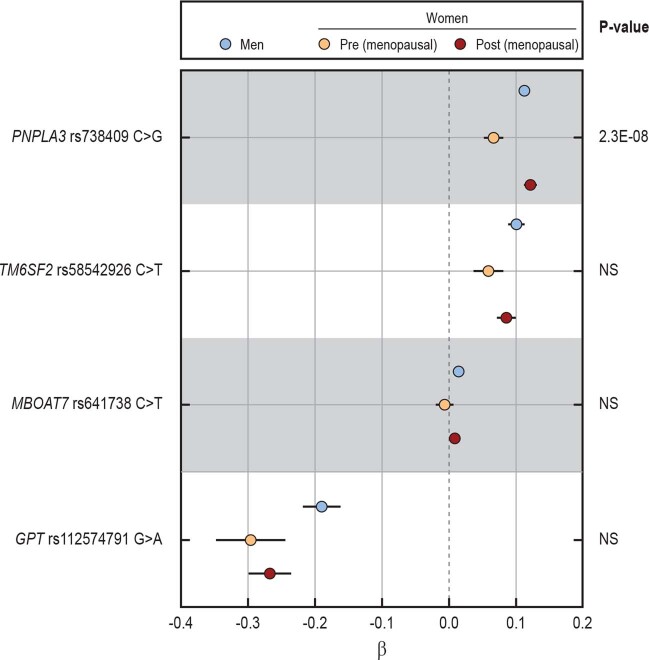
Extended Data Fig. 1. Comparison of the impact of PNPLA3 with other risk variants on ALT levels in UKBB Cohort stratified by sex and menopause.
Forest plot of association (estimates ± 95% c.i.) between PNPLA3 p.I148M, TM6SF2 p.E167K, MBOAT7-TMC4 rs641738 C > G and GPT p.R107K variants with sex on ALT levels in individuals in UKBB Cohort (n = 347,127) stratified by sex and menopause status. The impact of the variant was estimated by ordinal, logistic or generalized linear regression models, where appropriate under an additive genetic model for the different genetic variants, and were adjusted for age, BMI, T2D and recruitment modality. The impact of the variant was estimated by generalized linear regression models, under an additive genetic model for the PNPLA3 variant, and were adjusted for age, BMI, T2D and recruitment modality.

