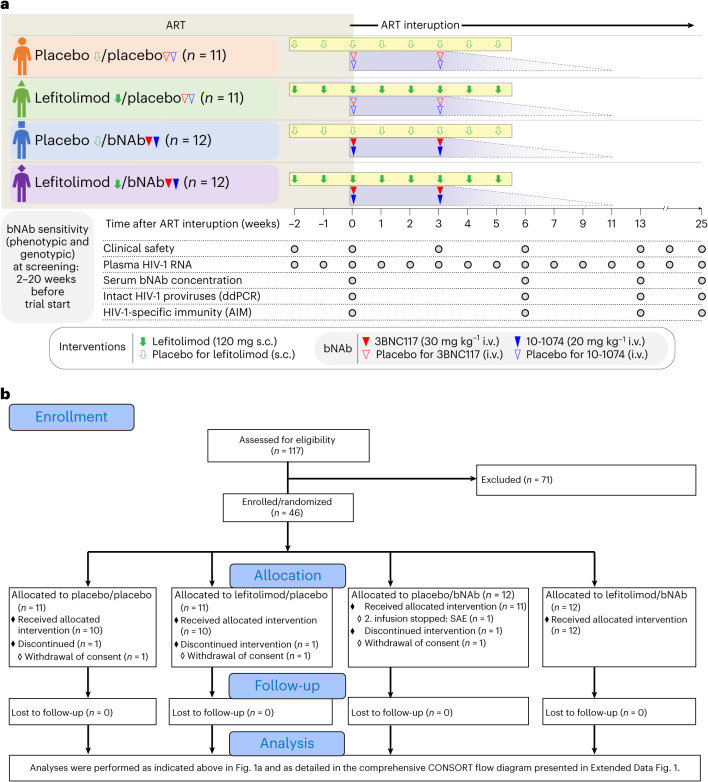
Fig. 1. TITAN trial design (a) and abbreviated CONSORT flow diagram (b).
Solid green arrows indicate lefitolimod injections. Solid red and blue triangles indicate 3BNC117 and 10-1074 infusions, respectively. Empty green arrows as well as red and blue triangles indicate placebo injections or infusions, respectively. Gray shaded areas indicate time on ART, and white shaded areas indicate still interrupting ART during the 25 weeks of ATI. The analysis section is presented in full in Extended Data Fig. 1. SAE, severe adverse event.

