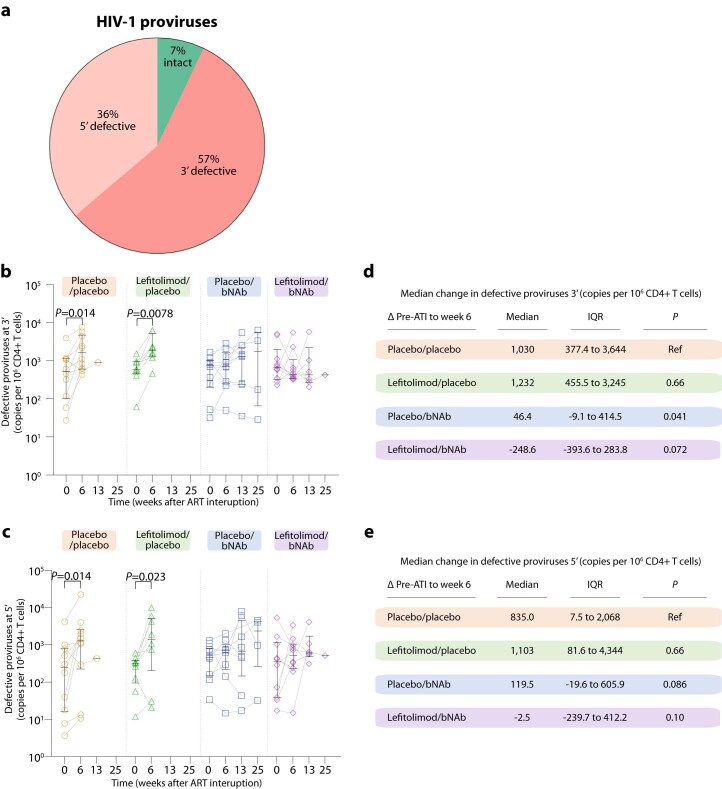
Extended Data Fig. 5. Fraction and size of the defective HIV-1 proviruses.
Mean fraction of intact, 3′ and 5′ defective HIV-1 proviruses per 106 CD4 + T cells from 39 individuals at ATI start (day 0) (a). The size of the 3’ (b) and 5’ (c) defective HIV-1 reservoir at ATI start (day 0) and after 6, 13 and 25 weeks of ATI among individuals in the four randomization groups (lines at median and IQRs). Placebo/placebo group (n = 10); lefitolimod/placebo (n = 9); placebo/bNAb (n = 10); and lefitolimod/bNAb (n = 11). All weeks are shown, including weeks with no data available. Median change in the 3’ (d) and 5’ (e) defective HIV-1 reservoir between week 6 of the ATI and pre-ATI for the four randomization groups are shown. Data are median and IQRs with the placebo/placebo group as the reference. Placebo/placebo group (n = 10); lefitolimod/placebo (n = 8); placebo/bNAb (n = 9); and lefitolimod/bNAb (n = 9). P values comparing within groups (only P values below 0.05 are shown) and between groups were calculated using the paired two-tailed Wilcoxon test and two-tailed Mann–Whitney test, respectively. ART, antiretroviral therapy; ATI, ART interruption; IQR, interquartile ranges; bNAb, broadly neutralizing antibody.

