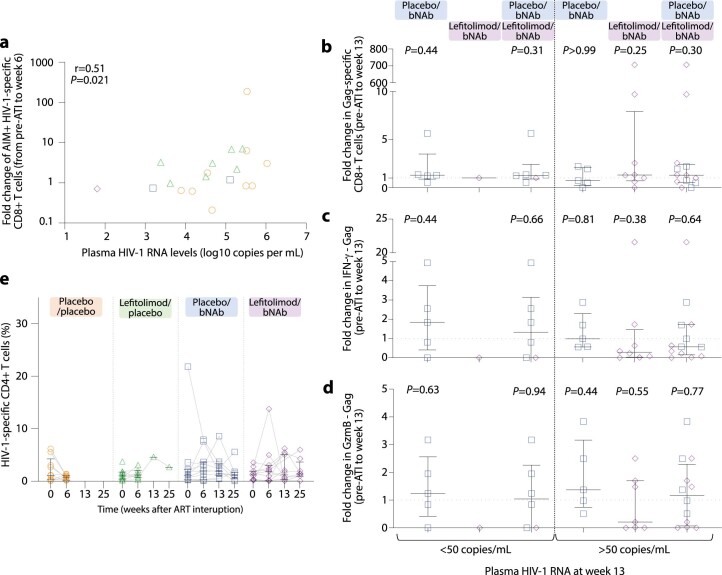
Extended Data Fig. 6. HIV-1-specific CD8+ and CD4+ immune responses during ATI.
(a) Correlation between fold change of HIV-1-specific CD8 + T cell response from pre-ATI to week 6 of ATI and measurable plasma HIV-1 RNA at week 6 with for participants with plasma HIV-1 RNA > 50 copies/mL. Placebo/placebo group (n = 9); lefitolimod/placebo (n = 7); placebo/bNAb (n = 2); and lefitolimod/bNAb (n = 1). P value calculated using two-tailed Spearman’s correlation coefficient. (b-d) Dot plot of median fold change in Gag-specific CD8 + T cells and Gag-induced INF-γ or GzmB responses after 13 weeks of ATI among individuals with either plasma HIV-1 RNA below (left panel) or above (right panel) 50 copies per mL in the two randomization groups receiving bNAb combination (lines at median and IQRs). Plasma HIV-1 RNA below 50 copies/mL: Placebo/bNAb (n = 5); and lefitolimod/bNAb (n = 1), or above 50 copies/mL: Placebo/bNAb (n = 5); and lefitolimod/bNAb (n = 7 to 9). P values comparing within groups were calculated using the paired two-tailed Wilcoxon test. (e) Dot plot of the frequency of HIV-1-specific CD4 + T cells at ATI start (day 0) and after 6, 13 and 25 weeks of ATI among individuals in the four randomization groups (lines at median and IQRs). All weeks are shown, including weeks with no data available. Placebo/placebo group (n = 10); lefitolimod/placebo (n = 9); placebo/bNAb (n = 11); and lefitolimod/bNAb (n = 12). P values comparing within groups were calculated using the paired two-tailed Wilcoxon test. Only P values below 0.05 are shown. ART, antiretroviral therapy; ATI, ART interruption; bNAb, broadly neutralizing antibody; IQR, interquartile ranges.

