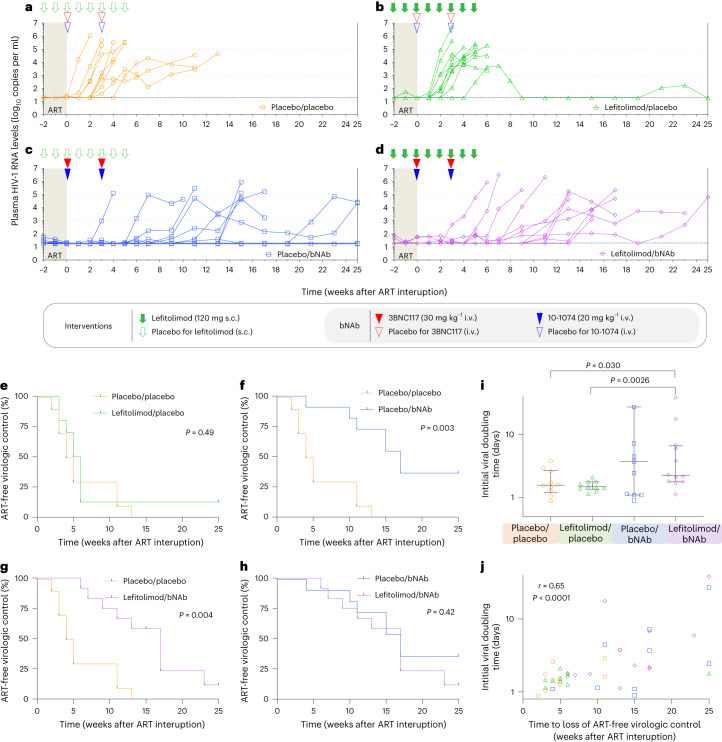
Fig. 2. Viral kinetics and time to loss of virologic control during 25 weeks of ATI.
a–d, Individual plasma HIV-1 RNA levels are shown in the four randomization groups during 25 weeks of ATI: a, placebo/placebo group (n = 10); b, lefitolimod/placebo (n = 10); c, placebo/bNAb (n = 11); and d, lefitolimod/bNAb (n = 12). Solid green arrows indicate lefitolimod injections. Solid red and blue triangles indicate 3BNC117 and 10-1074 infusions, respectively. Empty green arrows as well as red and blue triangles indicate placebo injections or infusions, respectively. Light gray shaded areas indicate time on ART, and white shaded areas indicate still interrupting ART during the 25 weeks of ATI. The three horizontal dotted lines indicates plasma HIV-1 RNA limit of quantification and 1,000 and 100,000 copies per milliliter, respectively. Viral rebound was defined as 4 weeks with plasma HIV-RNA >1,000 copies per milliliter or two consecutive measurements >100,000 copies per milliliter. e–h, Kaplan–Meier curves showing the percentage of individuals still interrupting ART during the 25 weeks of ATI. Time to loss of virologic control for the three active interventional groups compared to the placebo/placebo group: lefitolimod/placebo (e), placebo/bNAb (f) and lefitolimod/bNAb (g). h, Time to loss of virologic control for the placebo/bNAb group compared to the letifolimod/bNAb group. P values were calculated using the log-rank test. i, Dot plot of the initial viral doubling time in plasma HIV-1 RNA during ATI among the four randomization groups. The number of individuals per group is as stated for a–d, but the two individuals with completed virologic control in the placebo/bNAb group were given a high doubling time of 100 d beyond the axis to be included and to avoid skewing the data (lines at median and IQRs). P values comparing between groups were calculated using the two-tailed Mann–Whitney test. j, Correlation between time to loss of ART-free virologic control during the 25 weeks of ATI and initial viral doubling time among the four randomization groups. The number of individuals per group is as stated in i. P value was calculated using two-tailed Spearman’s correlation coefficient.

