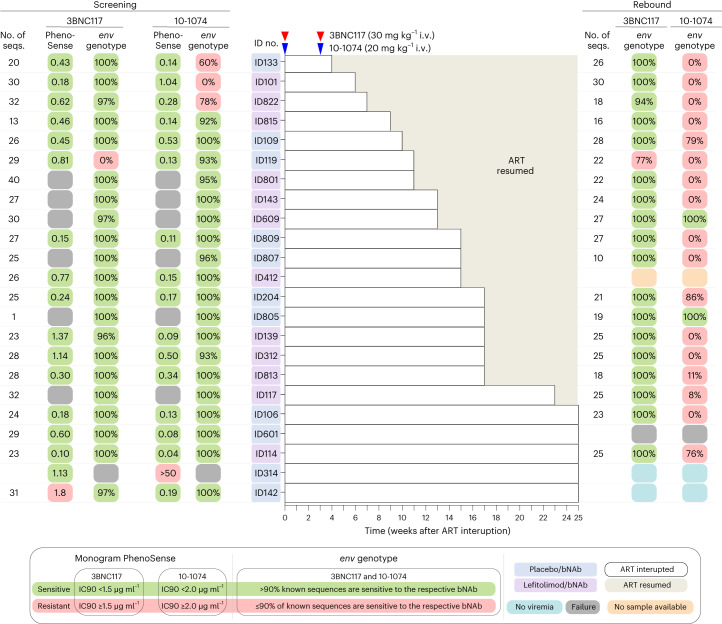
Fig. 3. bNAb sensitivity at screening and viral rebound.
bNAb sensitivity was primarily analyzed using the PhenoSense Monoclonal Antibody Assay with predefined IC90 thresholds for 3BNC117 (<1.5 µg ml−1) and 10-1074 (<2.0 µg ml−1) and MPI ≥98%. In six participants, the PhenoSense Assay failed, and we secondarily used proviral HIV-1 env sequences on a genotypic prediction algorithm with predefined thresholds of >90% known sequences are sensitive. One participant (ID142) was enrolled based upon the genotypically analysis, but post hoc phenotypic data showed an IC90 of 1.8 µg ml−1 for 3BNC117. In another participant (ID314), both the PhenoSense Assay and env sequencing initially failed, and we tertiary (Methods) included this individual based on the assumption that both assays failed due to a very small reservoir size, but post hoc phenotypic data showed archived 10-1074-resistant proviruses. For individuals enrolled based upon the phenotypic data, genotypical data were subsequently obtained except for one participant (ID314). If the participants had reached criteria for viral rebound before or were viremic at the end of the 25 weeks of ATI, bNAb sensitivity using plasma HIV-1 env sequences was analyzed using the same genotypic prediction algorithm. ID412 did not have samples available at viral rebound, and env sequencing failed for ID601. ID314 and ID142 had complete virologic control at the end of the 25 weeks of ATI. Solid red and blue triangles indicate 3BNC117 and 10-1074 infusions, respectively. Light gray shaded areas indicate time on ART, and white shaded boxes indicate still interrupting ART during the 25 weeks of ATI. Dark gray boxes are assay failures; orange boxes are no samples available; and dark blue boxes are no viremia at the end of 25-week ATI.

