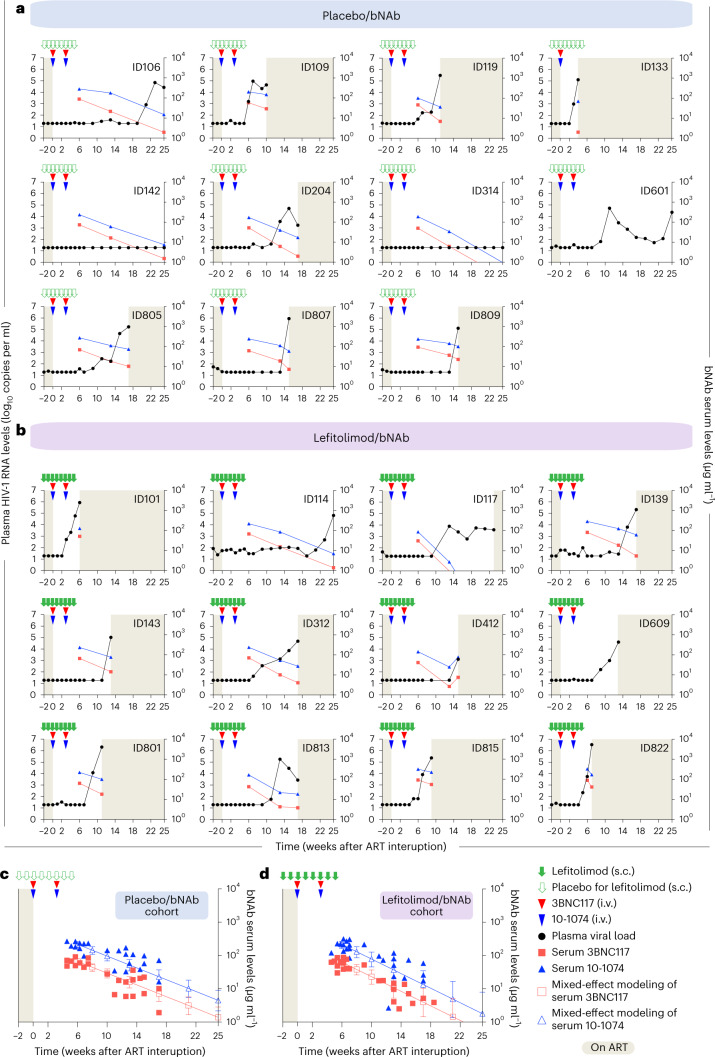
Fig. 4. Plasma HIV-1 RNA and bNAb serum levels for the two bNAb groups.
a,b, Plasma HIV-1 RNA (solid black dot with line; left y axis) and bNAb serum concentrations (3BNC117, solid red square with line; 10-1074, solid blue triangle with line; right y axis) for the placebo/bNAb group (a) and lefitolimod/bNAb group (b) during 25 weeks of ATI. Solid green arrows indicate lefitolimod injections. Solid red and blue triangles indicate 3BNC117 and 10-1074 infusions, respectively. Empty green arrows as well as red and blue triangles indicate placebo injections or infusions, respectively. Gray shaded areas indicate time on ART, and white shaded areas indicate still interrupting ART during the 25 weeks of ATI. The lower limit of quantification of plasma HIV-1 RNA was 20 copies per milliliter. In the placebo/bNAb group, serum concentration is shown for 10 individuals; ID601 did not have serum samples taken; and ID133 received only the first bNAb infusions due to a severe adverse event. In the lefitolimod/bNAb groups, serum concentration is shown for all individuals (n = 11) except ID609, who did not have serum samples taken. c,d, Group levels of bNAb serum concentrations for the placebo/bNAb group (n = 10) (c) and lefitolimod/bNAb group (n = 11) (d) during 25 weeks of ATI. Mixed-effect modeling with open squares and triangles with lines for mean (s.d.) 3BNC117 and 10-1074 serum concentrations, respectively, during 25 weeks of ATI.

