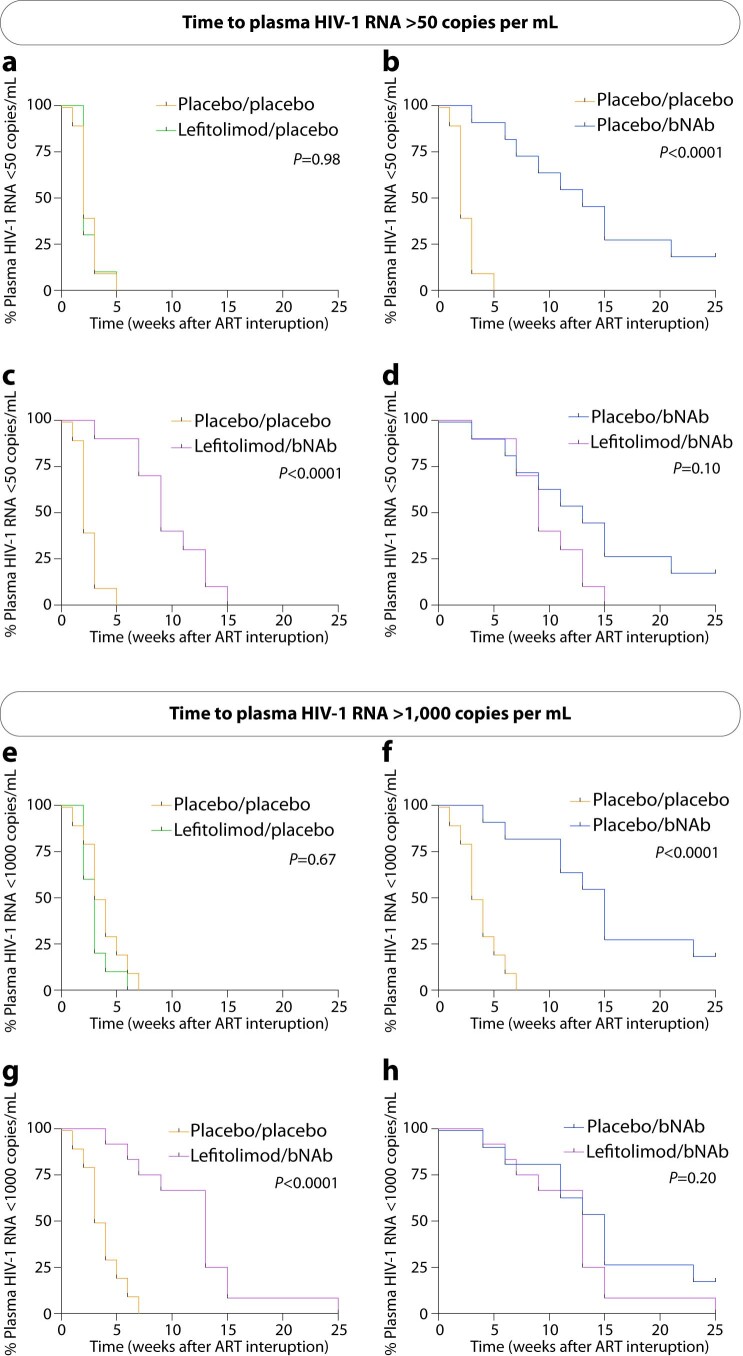
Extended Data Fig. 2. Time to plasma HIV-1 RNA above 50 and 1,000 copies/mL during 25 weeks of ATI.
(a-h) Kaplan–Meier curves showing the percentage of individuals still interrupting ART with plasma HIV-1 RNA < 50 and <1,000 copies/mL during the 25 weeks of ATI for the three active interventional groups compared to the placebo/placebo group: Lefitolimod/placebo (a, e), placebo/bNAb (b, f) and lefitolimod/bNAb (c, g). Kaplan–Meier curves showing the percentage of individuals still interrupting ART with plasma HIV-1 RNA < 50 and <1,000 copies/mL during the 25 weeks of ATI for the placebo/bNAb group compared to the lefitolimod/bNAb group (d, h). P values were calculated using the log-rank test. ART, antiretroviral therapy; ATI, ART interruption; bNAb, broadly neutralizing antibody.

