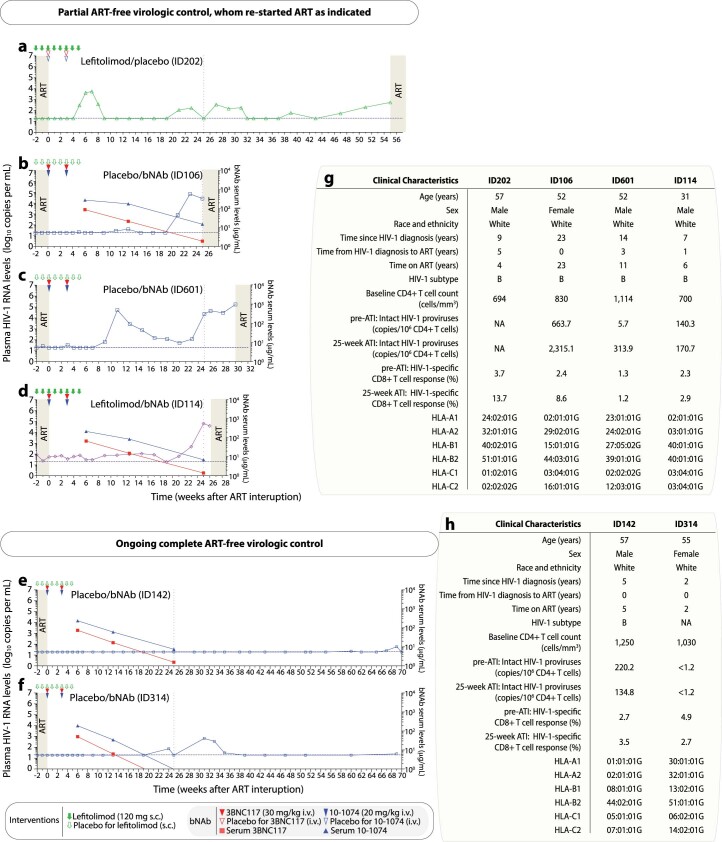
Extended Data Fig. 3. Plasma HIV-1 RNA kinetics for participants with partial and ongoing complete ART-free virologic control during the 25 weeks of ATI.
(a-d) Individual plasma HIV-1 RNA levels are shown in the four participants (ID202, ID106, ID601 and ID114) with partial ART-free virologic control during 25 weeks of ATI, whom re-started ART as indicated. (e, f) Individual plasma HIV-1 RNA levels are shown in the two participants (ID142 and ID314) with ongoing complete ART-free virologic control during 25 weeks of ATI. Solid green arrows indicate lefitolimod injections. Solid red and blue triangles indicate 3BNC117 and 10-1074 infusions, respectively. Empty green arrows as well as red and blue triangles indicate placebo injections or infusions, respectively. Plasma HIV-1 RNA (group-colored symbols with line; left y-axis) and bNAb serum concentrations (3BNC117, solid red square with line; 10-1074, solid blue triangle with line; right y-axis) during ATI, ID601 did not have serum samples taken. Light grey shaded areas indicate time on ART, while white shaded areas indicate still interrupting ART. The vertical dotted line at week 25 indicates end-of-study time point. (g-h) Overview of the clinical characteristics for participants with partial and ongoing complete ART-free virologic control during the 25 weeks of ATI. ART, antiretroviral therapy; ATI, ART interruption; bNAb, broadly neutralizing antibody; HLA, human leukocyte antigen; NA, not available; i.v., intravenous; s.c., subcutaneous.

