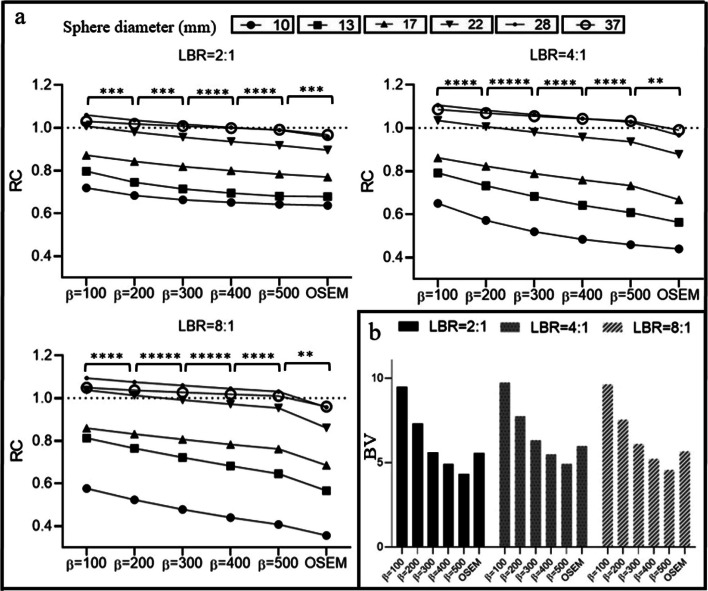
Fig. 2.
a A schematic comparison of hot spheres of different sizes (10 mm, 13 mm, 17 mm, 22 mm, 28 mm, and 37 mm) in RC versus different reconstruction algorithms (with OSEM and Q.Clear employing β values ranging from 100 to 500 at 100-point intervals). The data were acquired using a NEMA image quality phantom filled with lesion-to-background ratios (LBR) of 2:1, 4:1, and 8:1. b Results for background variability in OSEM and Q.Clear using the same β values (100–500) and LBRs. Note that the dashed line depicted the optimal RC, which is equal to 1. The asterisks in the figures symbolize the p values resulting from the paired t test conducted between the two reconstruction methods, wherein * indicates p < 0.01, ** indicates p < 0.001, *** indicates p < 0.0001, **** indicates p < 0.00001 and ***** indicates p < 0.000001

