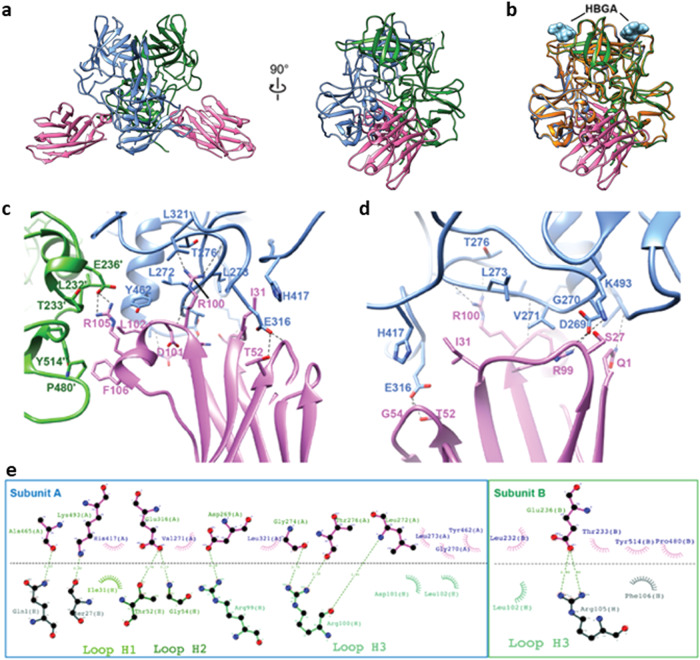
Fig. 2. Nanobody M4 in complex with GII.4 Sydney/2012 P-domain.
a X-ray crystal structure of the M4-GII.4 P-domain complex. The two subunits of the P-domain dimer are colored blue and green. Nanobody M4 is shown in pink. b Superposition of M4-GII.4 P-domain complex with HBGA-GII.4 P-domain structure (orange, PDB ID: 5J35). The glycan fucosyllactose (2’-FL) is shown as cyan spheres to indicate the HBGA-binding sites for reference. c, d Close-up views of the interactions of M4 with two subunits of P-domain dimer. The subunits A and B of the P-domain dimer are colored in blue and green, respectively. The side chains of M4 and P-domain are shown as stick representations. The hydrogen bonds are shown as black dashed lines. e Antibody plot analysis using the program LigPlot+ v.2.2.5. Green dashed lines indicate the hydrogen bonds, and short spokes radiating from each atom or residue represent the hydrophobic contacts.

