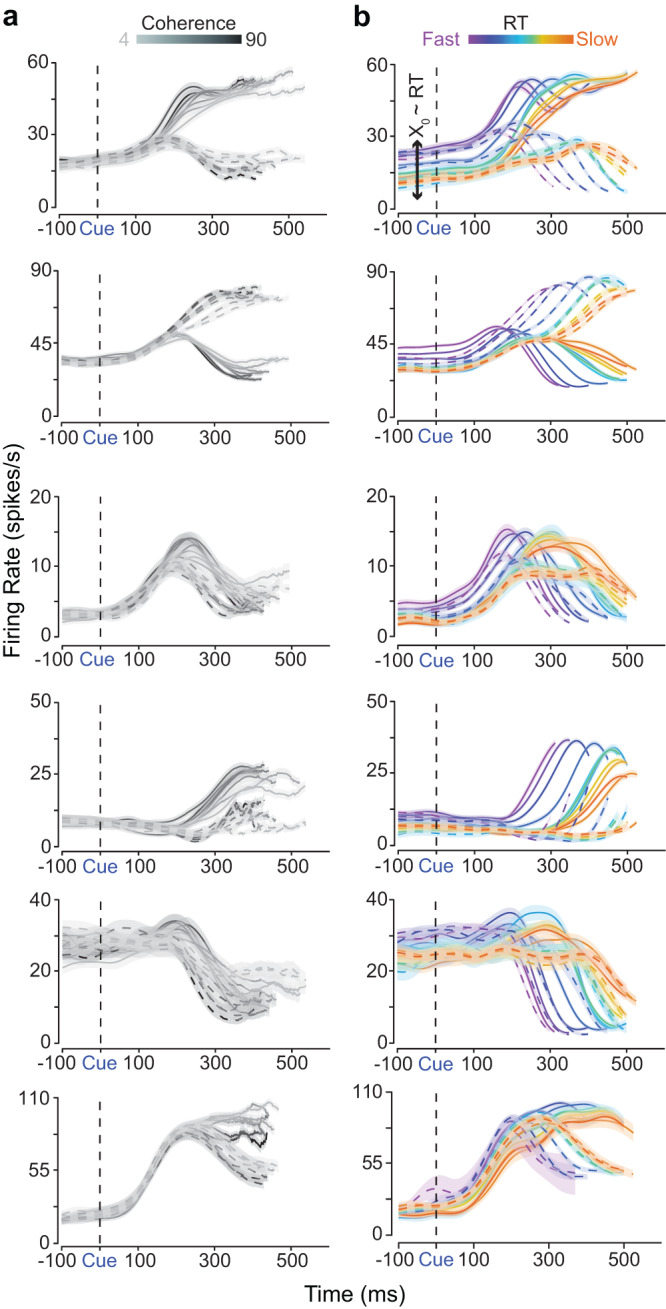
Fig. 3. Firing rates of a heterogeneous population of PMd neurons are modulated by the input (i.e., strength of the sensory evidence), and the initial condition (i.e., prestimulus firing rate) covaries with RT.

Firing rate across (a) 7 levels of color coherence (grayscale color bar with darker colors indicating easier coherences) and (b) 11 RT bins, from fast (violet) to slow (orange), for both action choices (right - dashed, left - solid) of 6 example units in PMd from monkeys T and O aligned to stimulus onset (Cue/vertical dashed black line). Firing rates are plotted until the median RT of each color coherence and until the midpoint of each RT bin (notice slightly different lengths of lines). Color-matched shading is SEM. In (a), firing rates tend to separate as a function of coherence, and in (b), the same neurons show prestimulus covariation as a function of RT (X0 ~ RT), and post-stimulus covariation with RT and choice. Source data are provided as a Source Data file.
