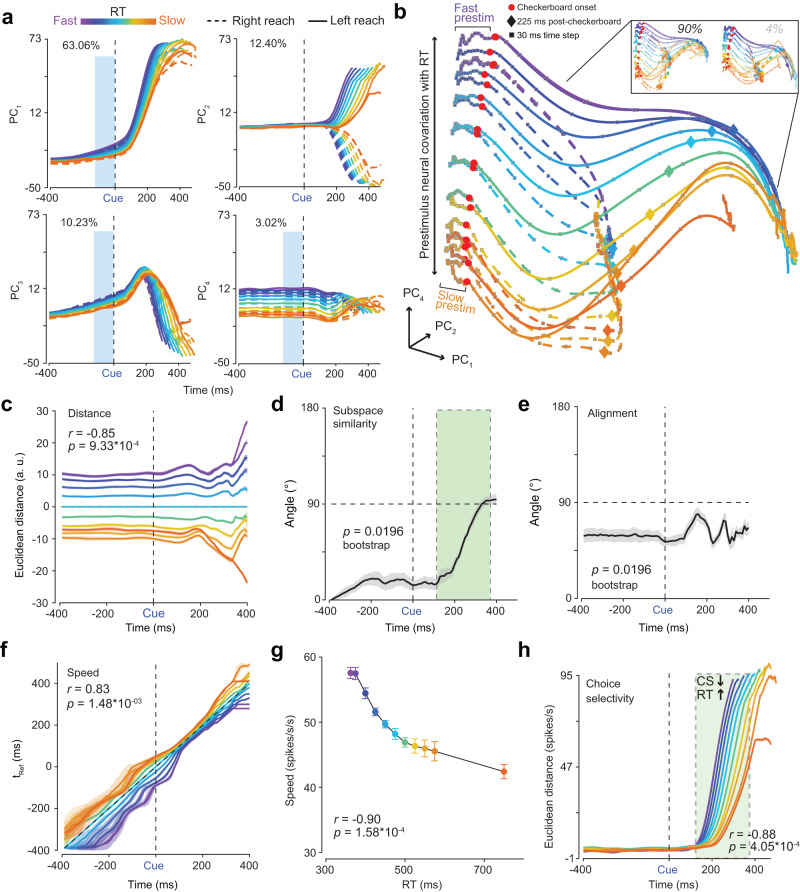
Fig. 4. Prestimulus population firing rates covary with RT.
a PCs1-4 of trial-averaged firing rates organized across 11 RT bins, both reach directions, and aligned to checkerboard onset. Percent variance explained is provided. Blue boxes highlight prestimulus covariation with RT. b State space trajectories of PCs1,2,4 aligned to checkerboard onset. Faster RT trajectories appear to move faster in the prestimulus period than slower RTs (fast/slow prestim, also see g). Inset: State space trajectories within a single stimulus coherence (i.e., 90% and 4%). c KiNeT distance analysis showing consistent spatial organization of trajectories peristimulus and correlated with RT. d Angle between subspace vector at the first timepoint (-400 ms) and subspace vector at each timepoint is largely consistent but increases as choice signals emerge (green box). e Average relative angle between adjacent trajectories at each timepoint was largely less than 90∘ for the prestimulus period but approach orthogonality as choice signals emerge poststimulus. f KiNeT Time to reference (tRef) analysis shows that trajectories for faster RTs reach similar points on the reference trajectory (cyan, middle trajectory) earlier than trajectories for slower RTs. g Average scalar speed for the prestimulus period (-400 to 0 ms epoch) as a function of RT bin. h Choice-selectivity signal measured as the Euclidean distance in the first six dimensions between the two reach directions for each RT bin aligned to checkerboard onset. Rate for choice selectivity (CS) is faster for faster RTs compared to slower RTs (green box). In (c) and (f) the x-axis is time on the reference trajectory. Black dashed lines track the reference trajectory. In d & e black dashed horizontal line indicates 90∘. Error bars are color-matched SEM (n = 50 bootstraps) in (c)–(h). Correlations in (c)–(h) were tested with two-sided t tests. p values in (d) and (e) were derived from one-sided bootstrap tests (n = 50, comparison to 90∘). Cue, Checkerboard onset, a. u., Arbitrary units. Source data are provided as a Source Data file.

