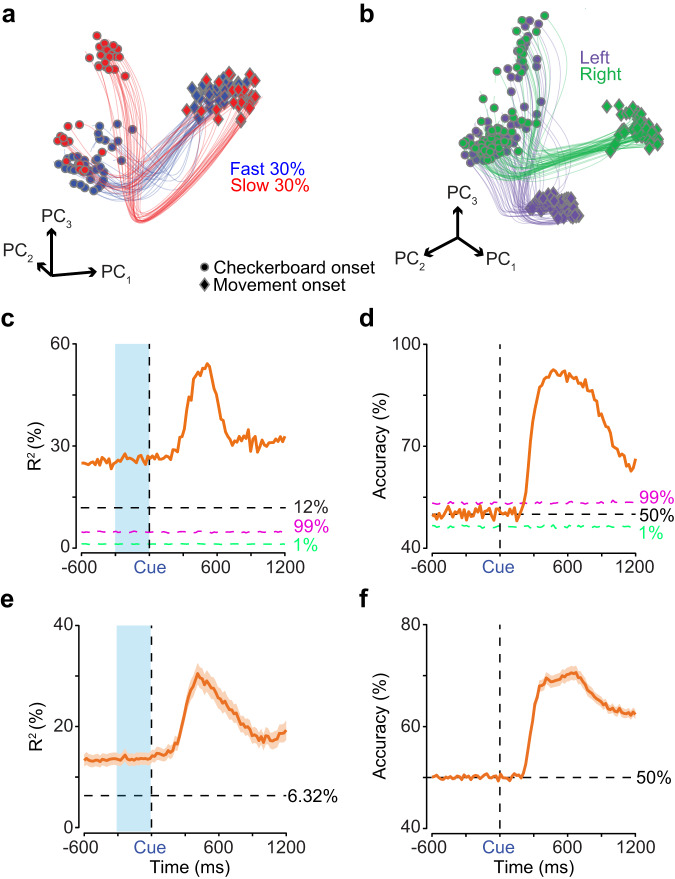
Fig. 6. Single-trial analysis, linear regression, and decoders reveal that initial conditions predict RT but not choice.
LFADS44 trajectories in the space of the first three orthogonalized factors (PC1,2,3), obtained via PCA on LFADS latents, plotted for (a) the fastest 30% of trials (blue) and the slowest 30% of trials (red) for left reaches and (b) for left (purple) and right (green) reaches, all for the easiest coherence from a single session (23 units). Each trajectory is plotted from 200 ms before checkerboard onset (dots) to movement onset (diamonds). c, d Variance explained (R2)/decoding accuracy from linear/logistic regressions of binned spiking activity (20 ms) and coherence to predict trial-matched RTs/eventual choice from all 23 units in the LFADS session shown in (a and b). Horizontal black dotted lines are the variance explained by a regression using stimulus coherence to predict RTs (12%) and 50% accuracy respectively. The magenta and light green dotted lines are the 99th and 1st percentiles of R2/accuracy values calculated from an analysis of trial-shuffled spiking activity (500 repetitions) and RTs/choice. e/f R2/accuracy values, calculated as in (c) and (d), averaged across 51 sessions. Orange shaded area is SEM. e 6.32% is the average percentage of variance explained across the 51 sessions for both monkeys by regressions using stimulus coherence to predict RTs. The horizontal black dotted line in (f) denotes 50% accuracy. Blue highlight boxes in (c) and (e) denote prestimulus neural covariability with RT. Cue - Checkerboard onset. Source data are provided as a Source Data file.

