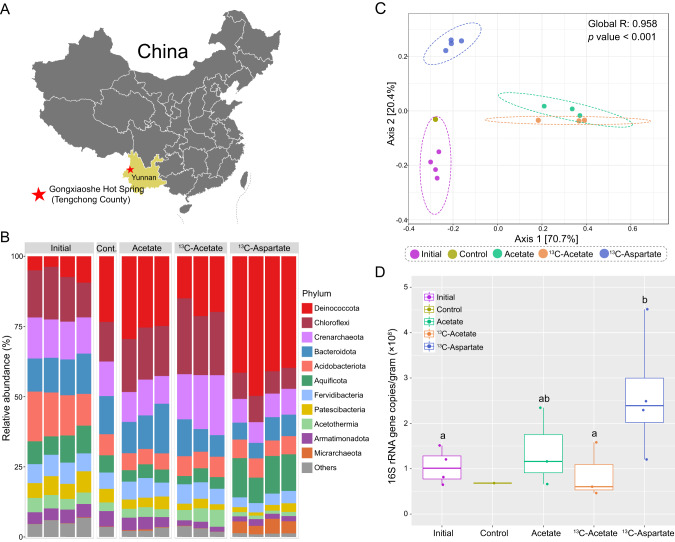
Fig. 1. Research location and microbial community response to acetate or aspartate addition.
A Location of Gongxiaoshe Hot Spring (red star). B Bar plots showing the relative abundance of microbial phyla before incubation (initial), after incubation without added substrate (control), or with 13C-acetate (n = 3) or 13C-aspartate (n = 4). C Effect of incubation on beta diversity. Principal coordinate analysis (PCoA) based on Bray-Curtis dissimilarity index of ASVs followed by ANOSIM significance test. The five groups are: initial (purple), control (brown), natural abundance acetate (green), 13C-acetate (orange), and 13C-aspartate (blue). Dotted ellipses represent 95% confidence intervals. D 16S rRNA gene copies per gram (wet weight) determined by qPCR. Different letters represent significant differences as determined by Kruskal–Wallis test. (p < 0.05).

